Introduction
The AlloMAPS database is a large collection of allosteric signalling data obtained for three protein datasets: 46 proteins with comprehensively annotated functional and allosteric sites; 1908 protein chains from PDBselect set of chains with low (less than 25%) sequence identity [1], which are structurally annotated on the basis of CATH classification [2]; 33 proteins with massive SNPs data. In the structure-based statistical mechanical model of allostery [3] calculations used, the allosteric effect caused by a perturbation (ligand binding or mutation [4]) of the harmonic model associated with the protein is obtained as a per-residue free energy difference between perturbed and unperturbed (Figure 1) protein states. Ligand binding is modelled via the harmonic constraints that increases rigidity of contacts between residue pairs in the binding site. Mutations are modelled by changing the force constant of interactions of the mutated residue's neighbours contact network. Two types of mutations are considered (Figure 1): (i) in the case of stabilizing (UP) mutations, increased rigidity in the local network of the residue’s contacts models substitution into bulky amino acid; (ii) decrease of the interaction strength (increase of local flexibility) in destabilizing (DOWN) mutations mimics Ala/Gly-like mutations.
Given a perturbation (P) the response on a specific residue i is obtained from a statistical mechanical calculation on two protein states, perturbed vs. unperturbed. The background free allosteric effect, called allosteric modulation, is evaluated as a deviation of the obtained free energy difference from its mean value over the protein chain, [7].
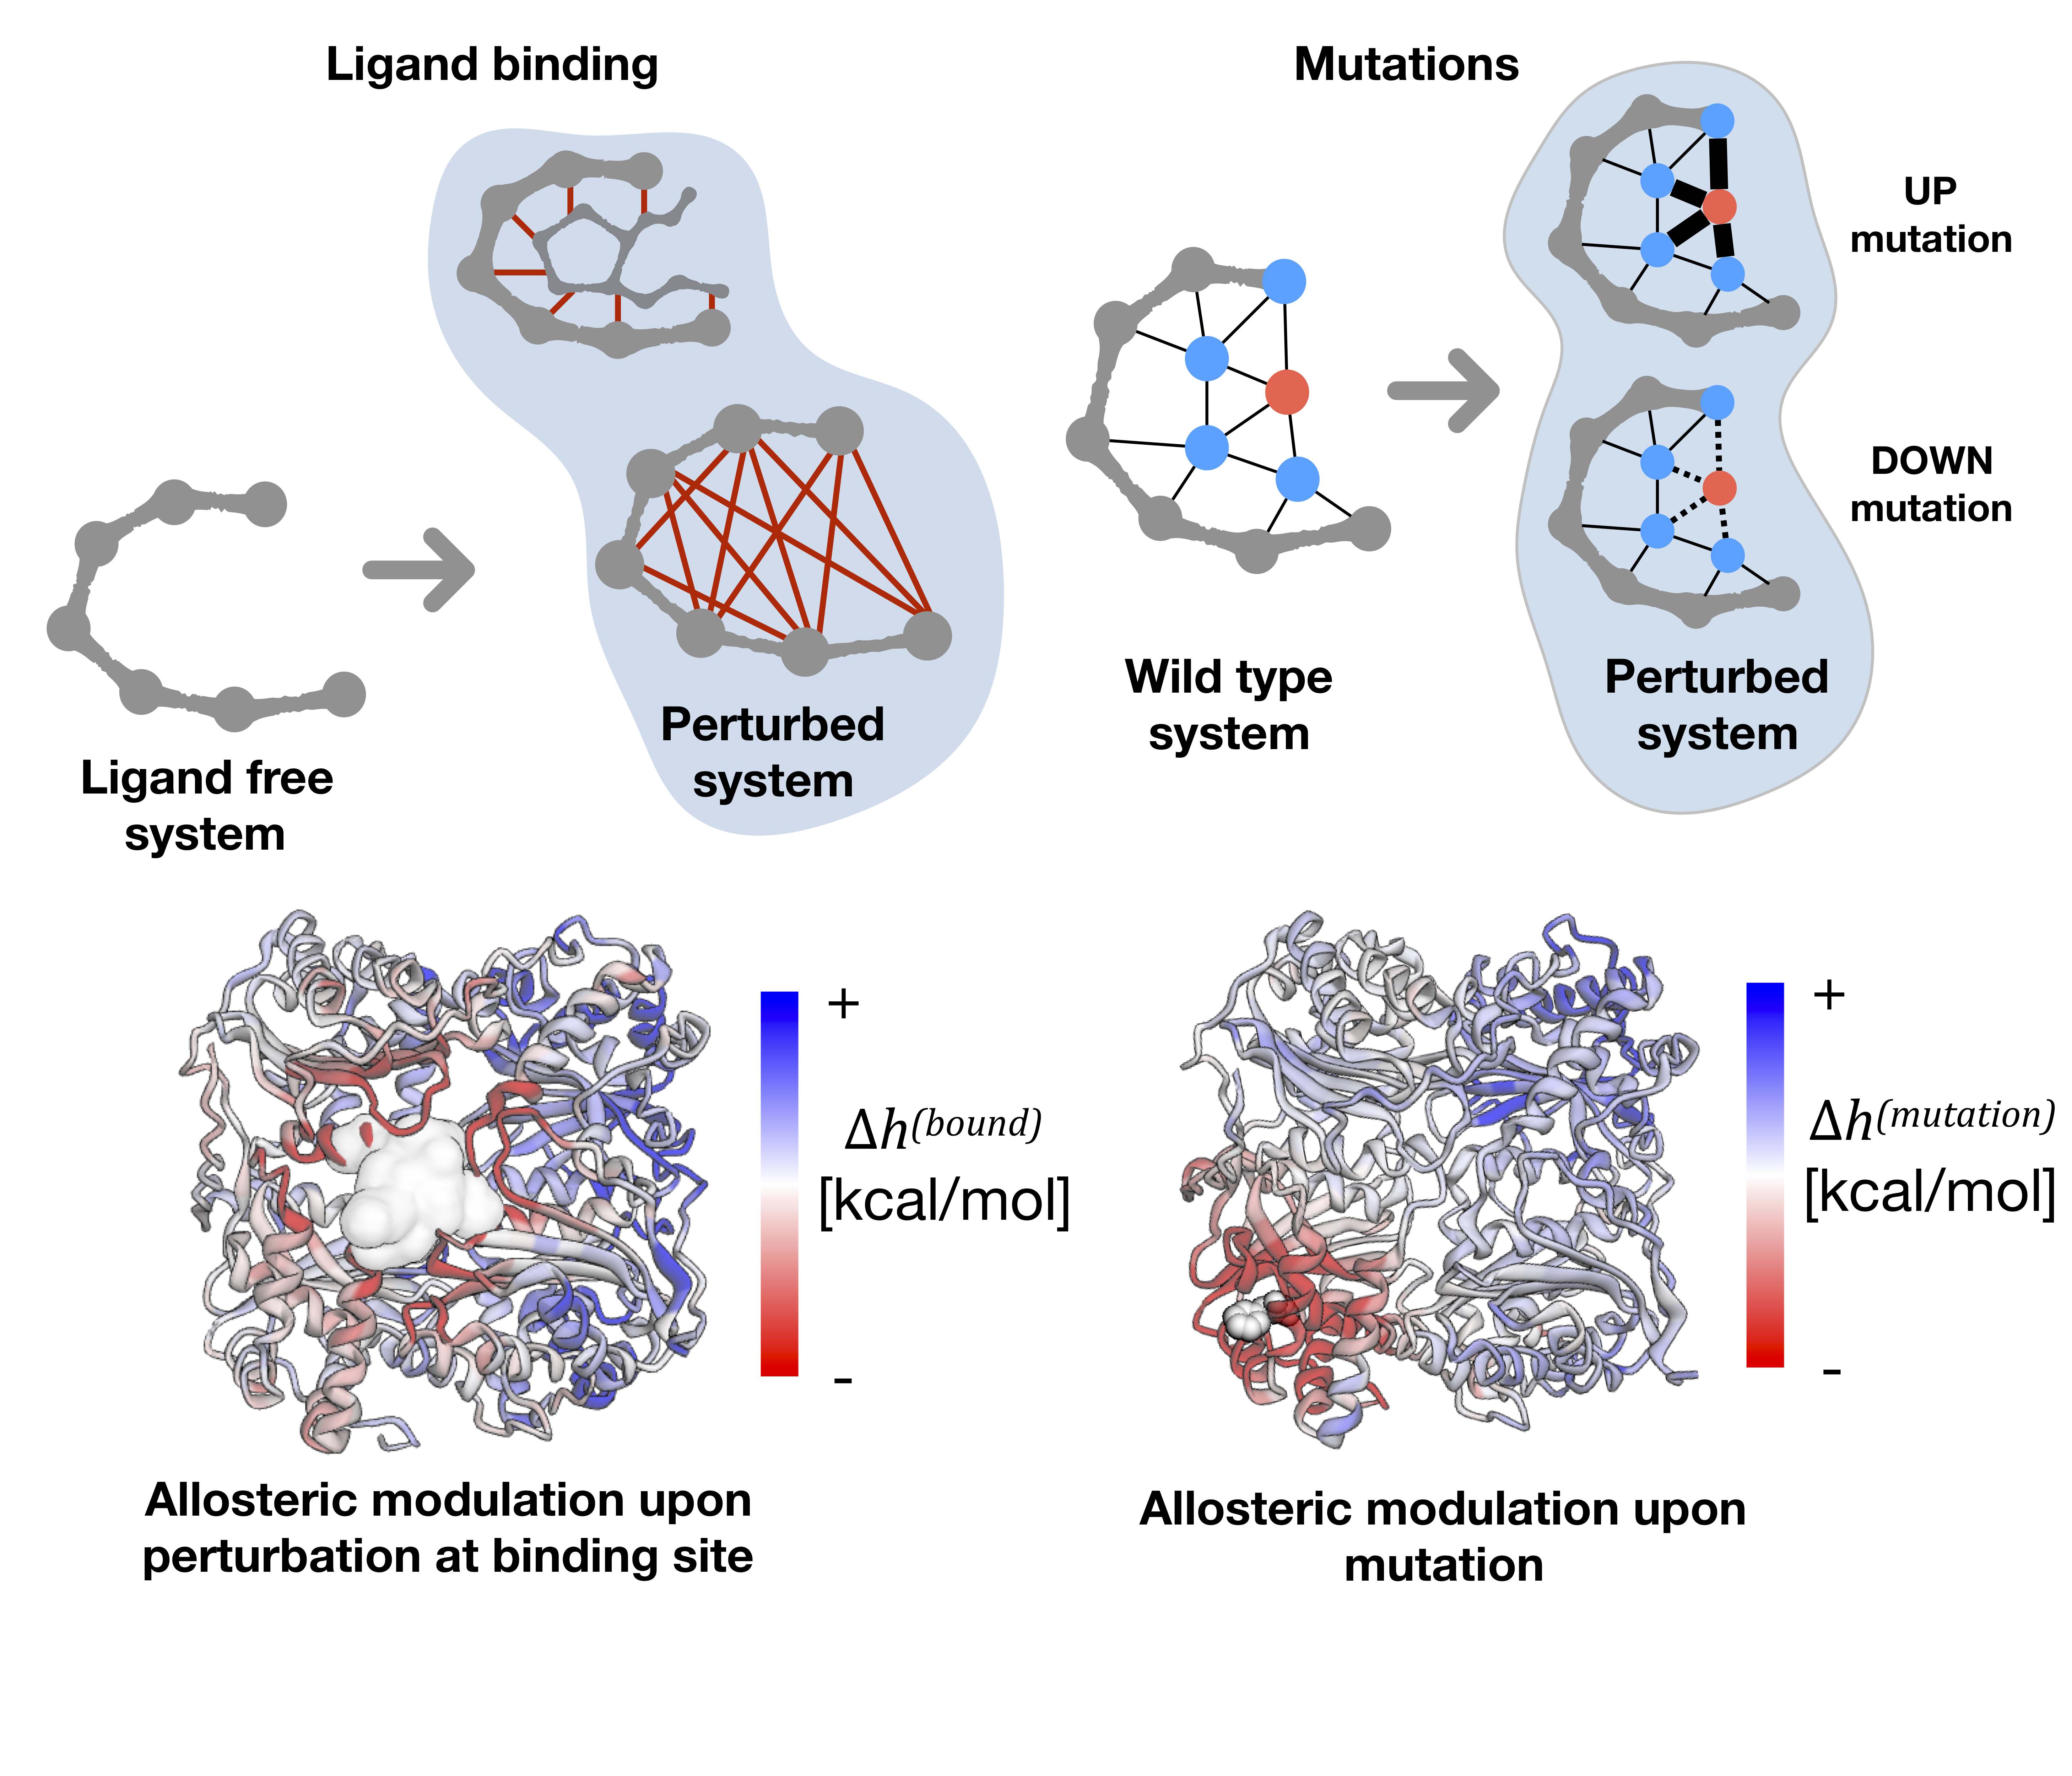
Figure 1: Perturbation-based allostery model and allosteric modulations observed
as a result of the ligand binding and mutations.
Typically, in investigating allosteric communication, one is interested in monitoring the effect of a perturbation on the functional (binding, catalytic etc.) sites. In order to do that, the free energy difference and allosteric modulations per site are obtained as averages over all the residues belonging to this site, and respectively.
A generic description of the allosteric effect of the amino acid substitution in a protein position, called modulation range, is calculated as a difference between the responses caused by a mutation in a certain protein position from the smallest (Ala/Gly-like) to the bulkiest amino acids.
AlloMAPS database is structurally divided into three parts (Figure 2):
Allosteric proteins. It includes a description of allosteric communication between known functional and allosteric sites in the manually curated set of 46 proteins with well-documented allosteric regulation.
PDBselect collection of protein chains. This part contains Allosteric Signalling Maps (ASMs) for the collection of 1908 protein chains from PDBselect.
Polymorphism. The set of 33 proteins with information on numerous SNPs.
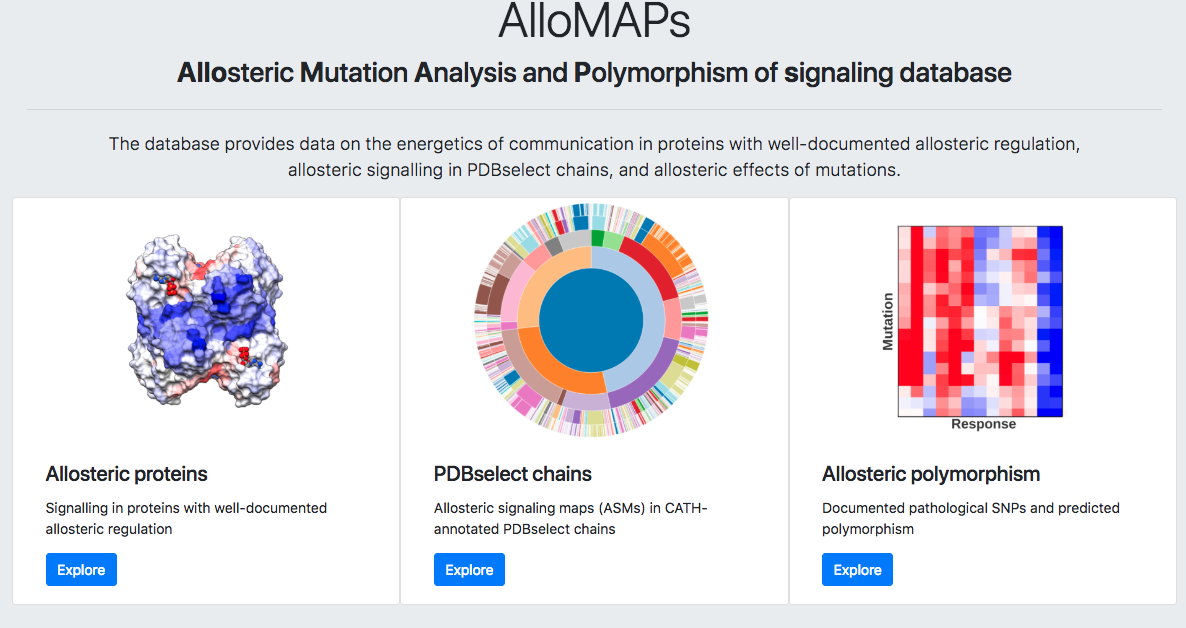
Figure 2: AlloMAPS homepage.
Allosteric Proteins
In the “Allosteric proteins” page users can access a database of proteins, which are consensually considered to be allosterically regulated and for which substantial experimental data on the functional site is available [3, 6]. We will use here the apo form of the ATP-dependent-6-phosphofructokinase (PFK, PDB ID: 3pfk) for a demonstration of all functionalities in this part of the database. The list of proteins (Figure 3) becomes available when the user hits "Explore" button in the “Allosteric proteins” section of the homepage. The content table contains five columns with information about the protein: PDB ID, UniProt ID, Gene name, Protein name, and Size (number of residues).
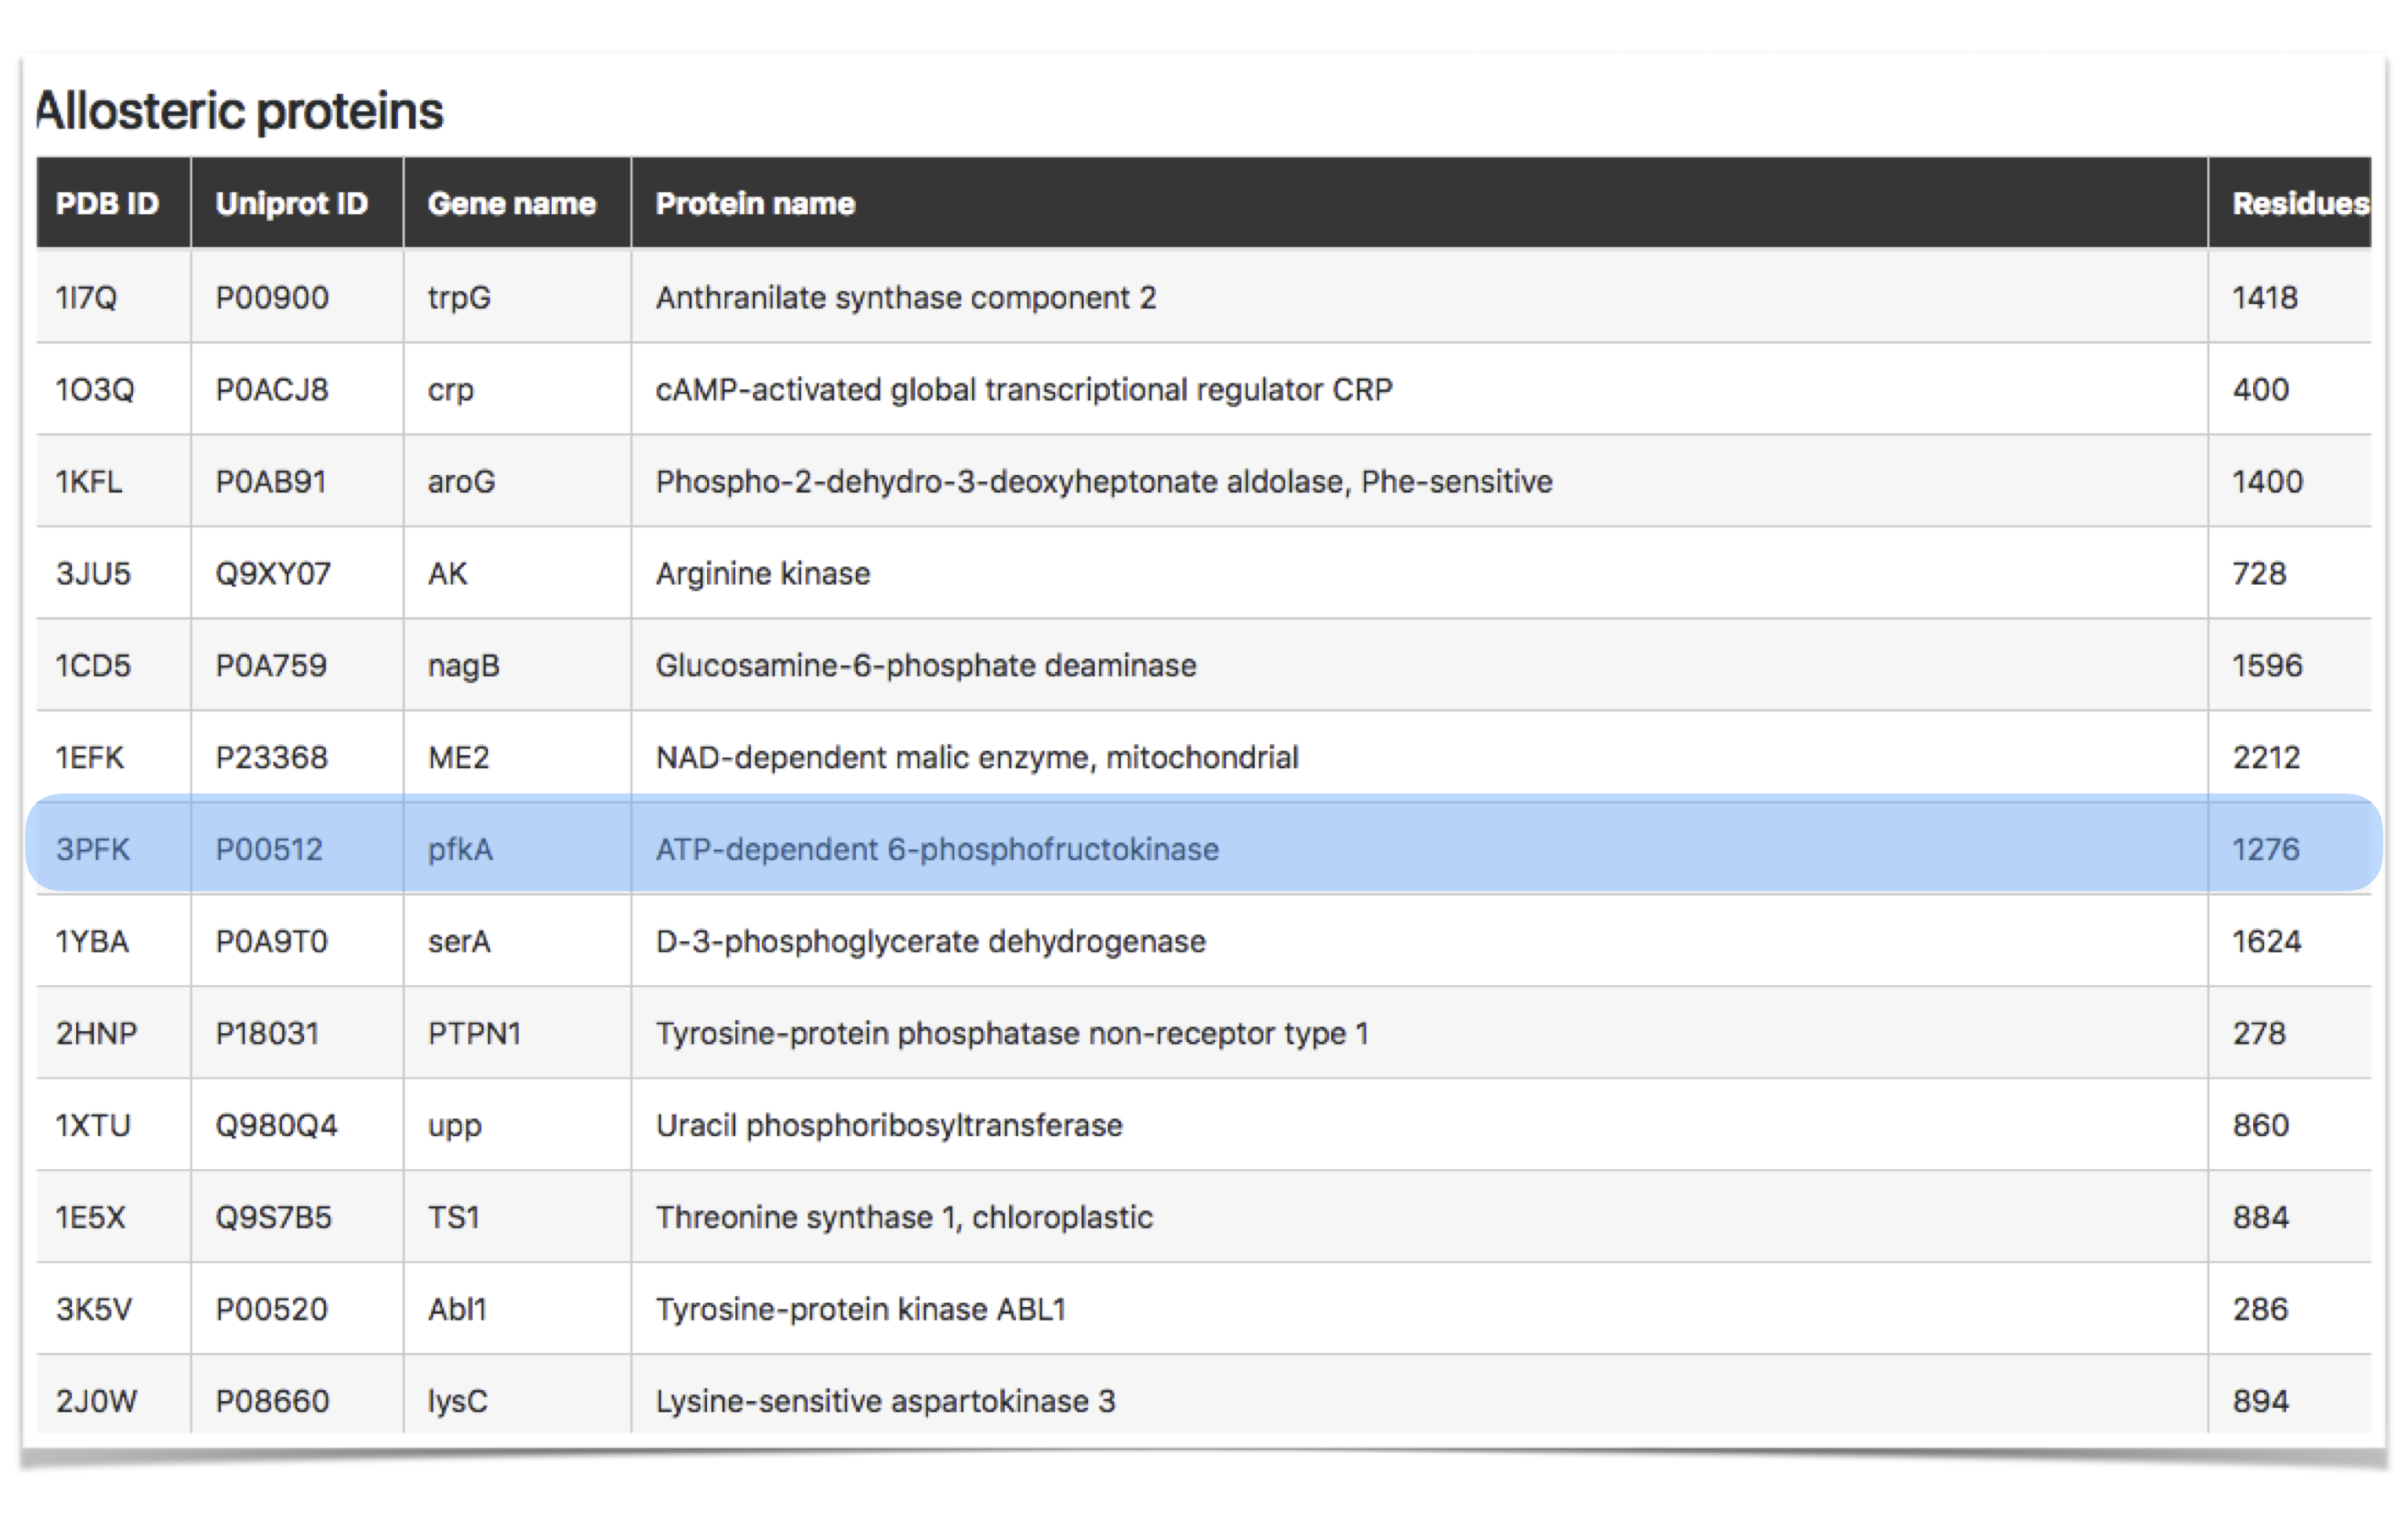
Figure 3: Allosteric proteins dataset
By clicking on a protein record 3pfk, the user will enter the main page for PFK record. NOTE: Loading of individual protein records may take up to a couple of minutes, depending on the size of the system. As shown in Figure 4, the page is organized into three parts. On the top of the page, a small protein info panel can be accessed by clicking on the protein name. This panel contains a brief description of the protein, known binding sites, and links to corresponding PDB and UniProt records. Visualization of the protein and observed allosteric effects, the "Structure view" panel, is provided on the left side of the page. Buttons representing known binding sites are listed in the panel.
On the right side there is a four-tab panel containing “Residue: Binding/Mutation”, “Allosteric Signaling Map”, “Sites: Mutation”, and “Sites: Binding” tabs. By default, the “Residue: Binding/Mutation” tab is shown with sequences of all protein’s chains. In the case of PFK there are 4xADPa (activator), 4xPEP (inhibitor), 4xF6P (catalytic), and 4xADPf (substrate). Pointing to one of the binding sites, the user will obtain the list of residues and surface visualization of the corresponding site in the protein structure.
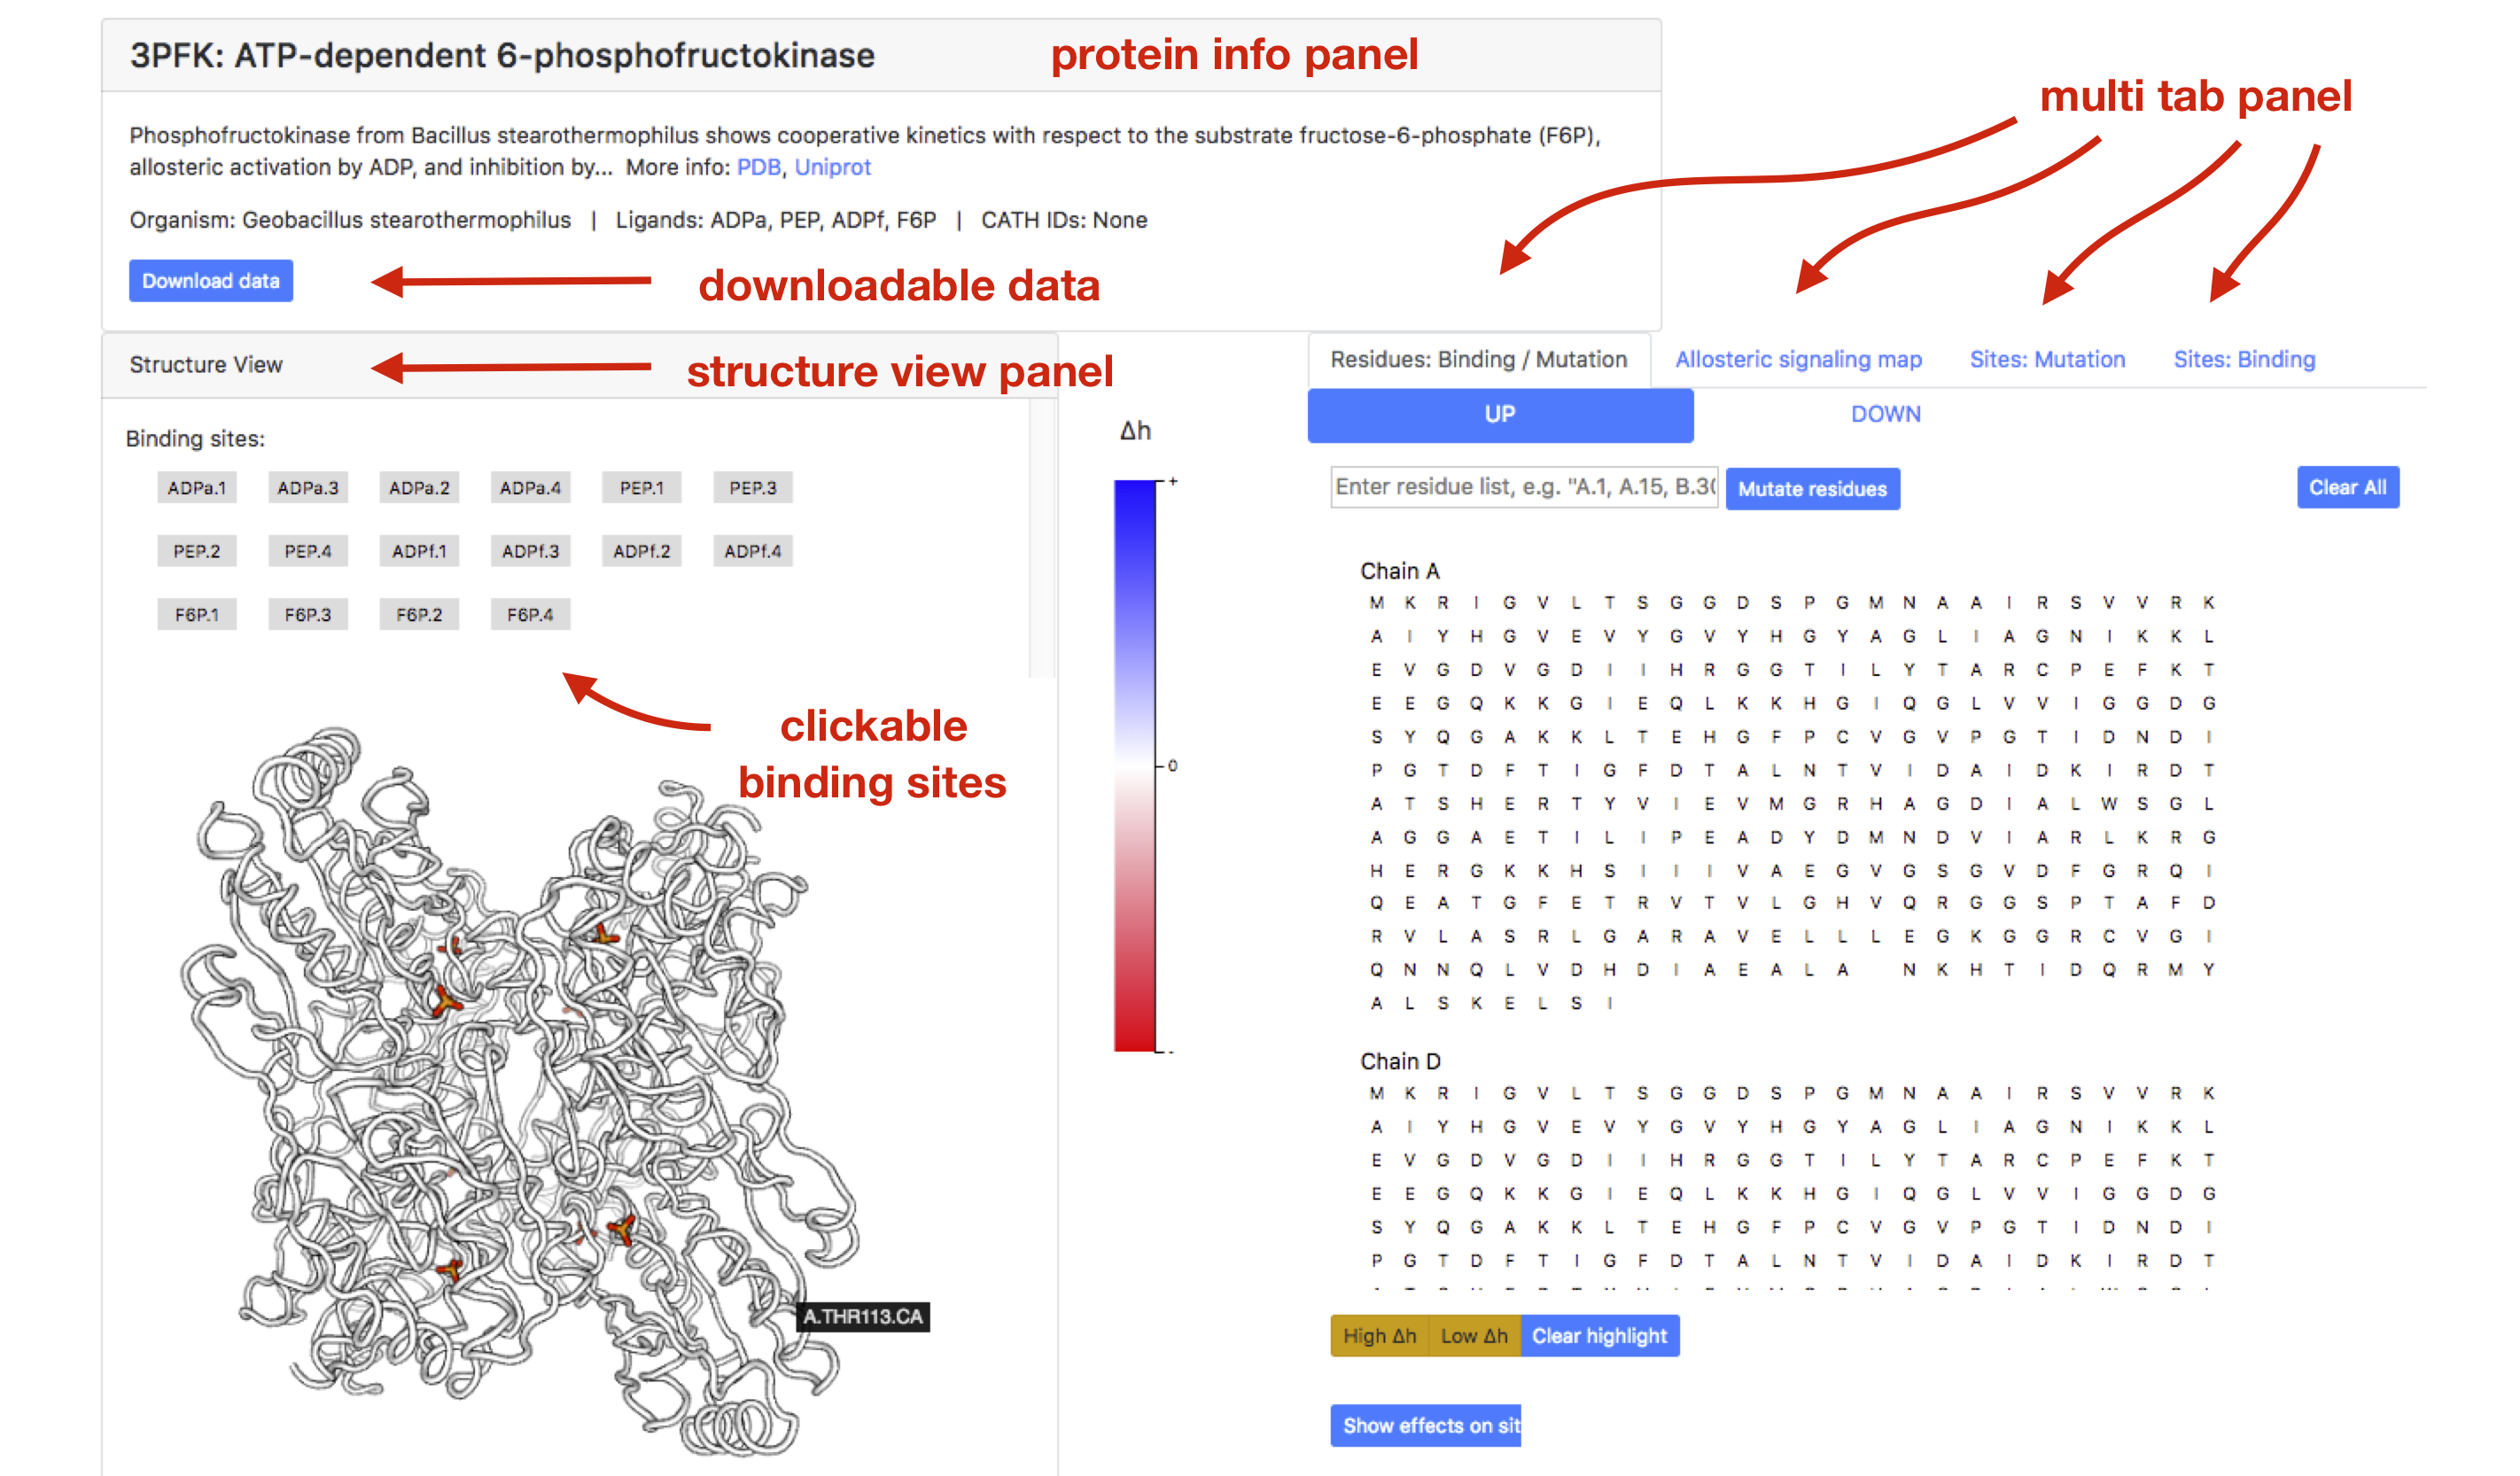
Figure 4: PFK as an example of an allosteric protein.
Binding data
Allosteric effect of the binding to a site can be observed by clicking on one of the sites listed in the “Structure view” panel. Figure 5 shows the data on allosteric modulation initiated by the binding to one of the activator sites, ADPa.1. The data is visualized on both the protein structure view (left panel) and the sequence view (right panel). The color gradient reflects a change in the work performed on a residue by its neighbourhood upon the ligand binding: decrease (negative modulation) – red, increased (positive modulation) – blue, no change - white. By pointing the mouse over one residue in the sequence, the user can obtain the actual value of allosteric modulation in kcal/mol.
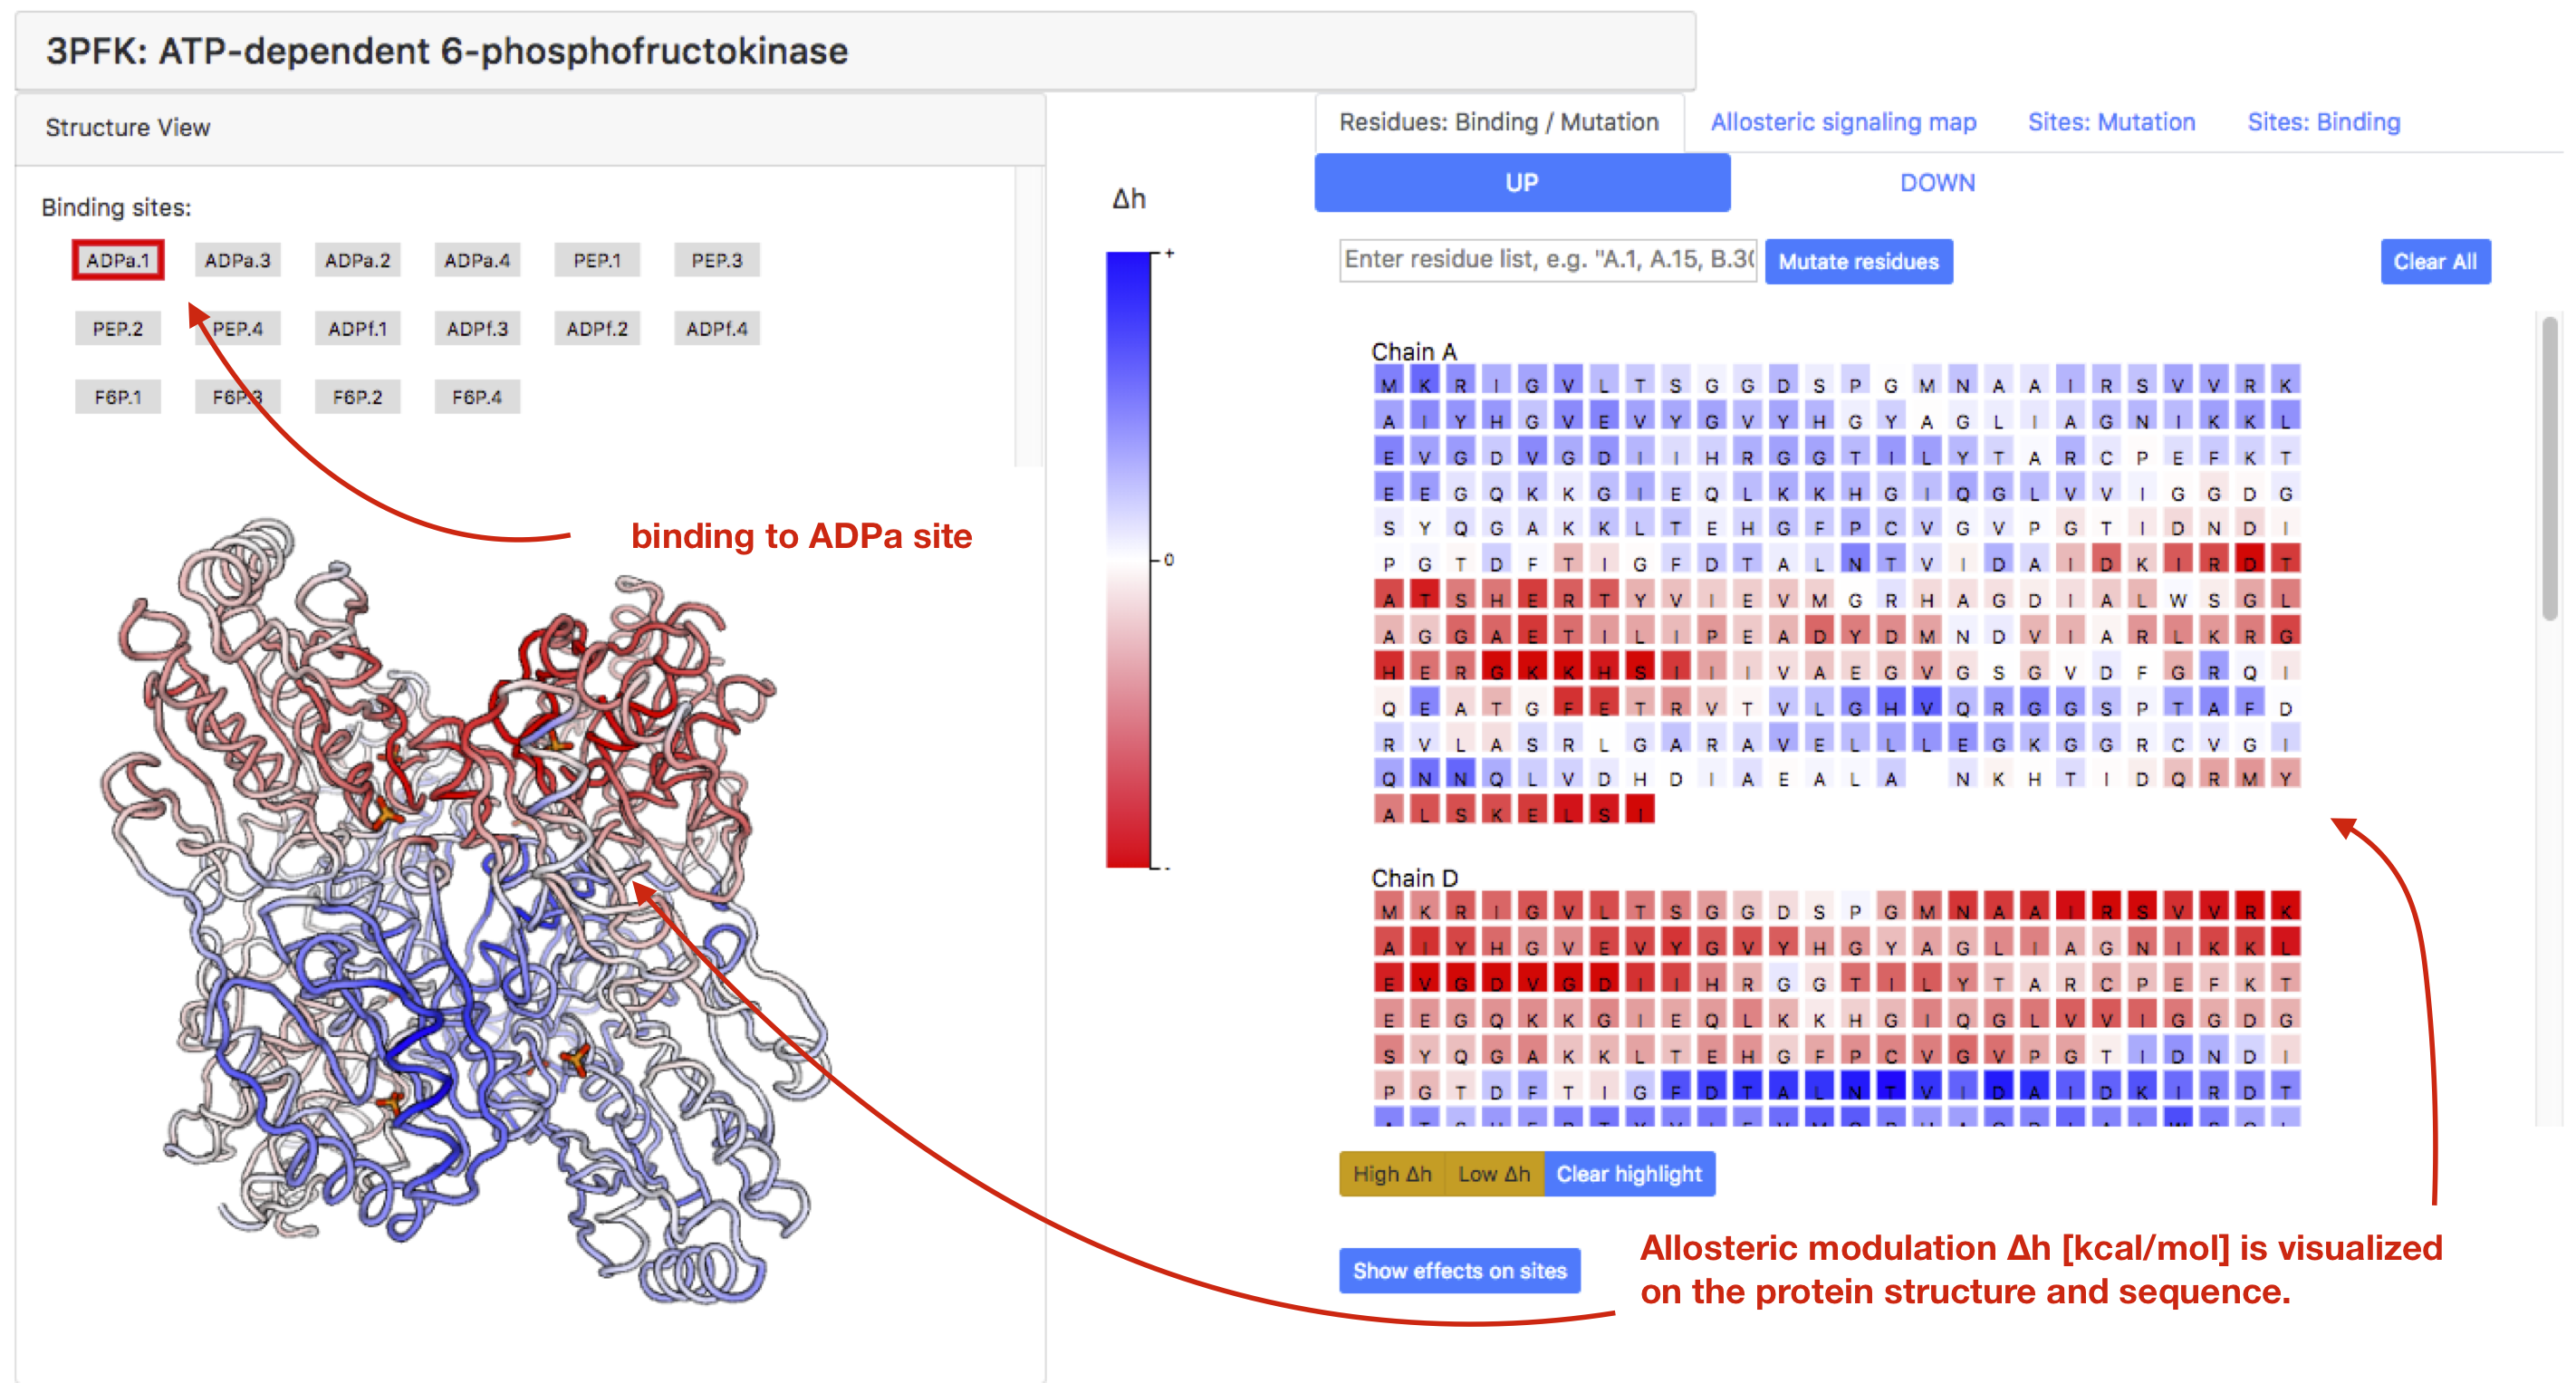
Figure 5: Inspecting the effect of binding to the ADPa.1 site in PFK.
The data on allosteric modulation upon binding of multiple ligands can be accessed by clicking on several sites simultaneously. Figure 6 shows the allosteric modulation data in case of binding to one, two, there, and four ADPa binding sites. Arrows in the figure show locations of binding sites, which can be visualized in structure upon pointing the mouse on the site button.
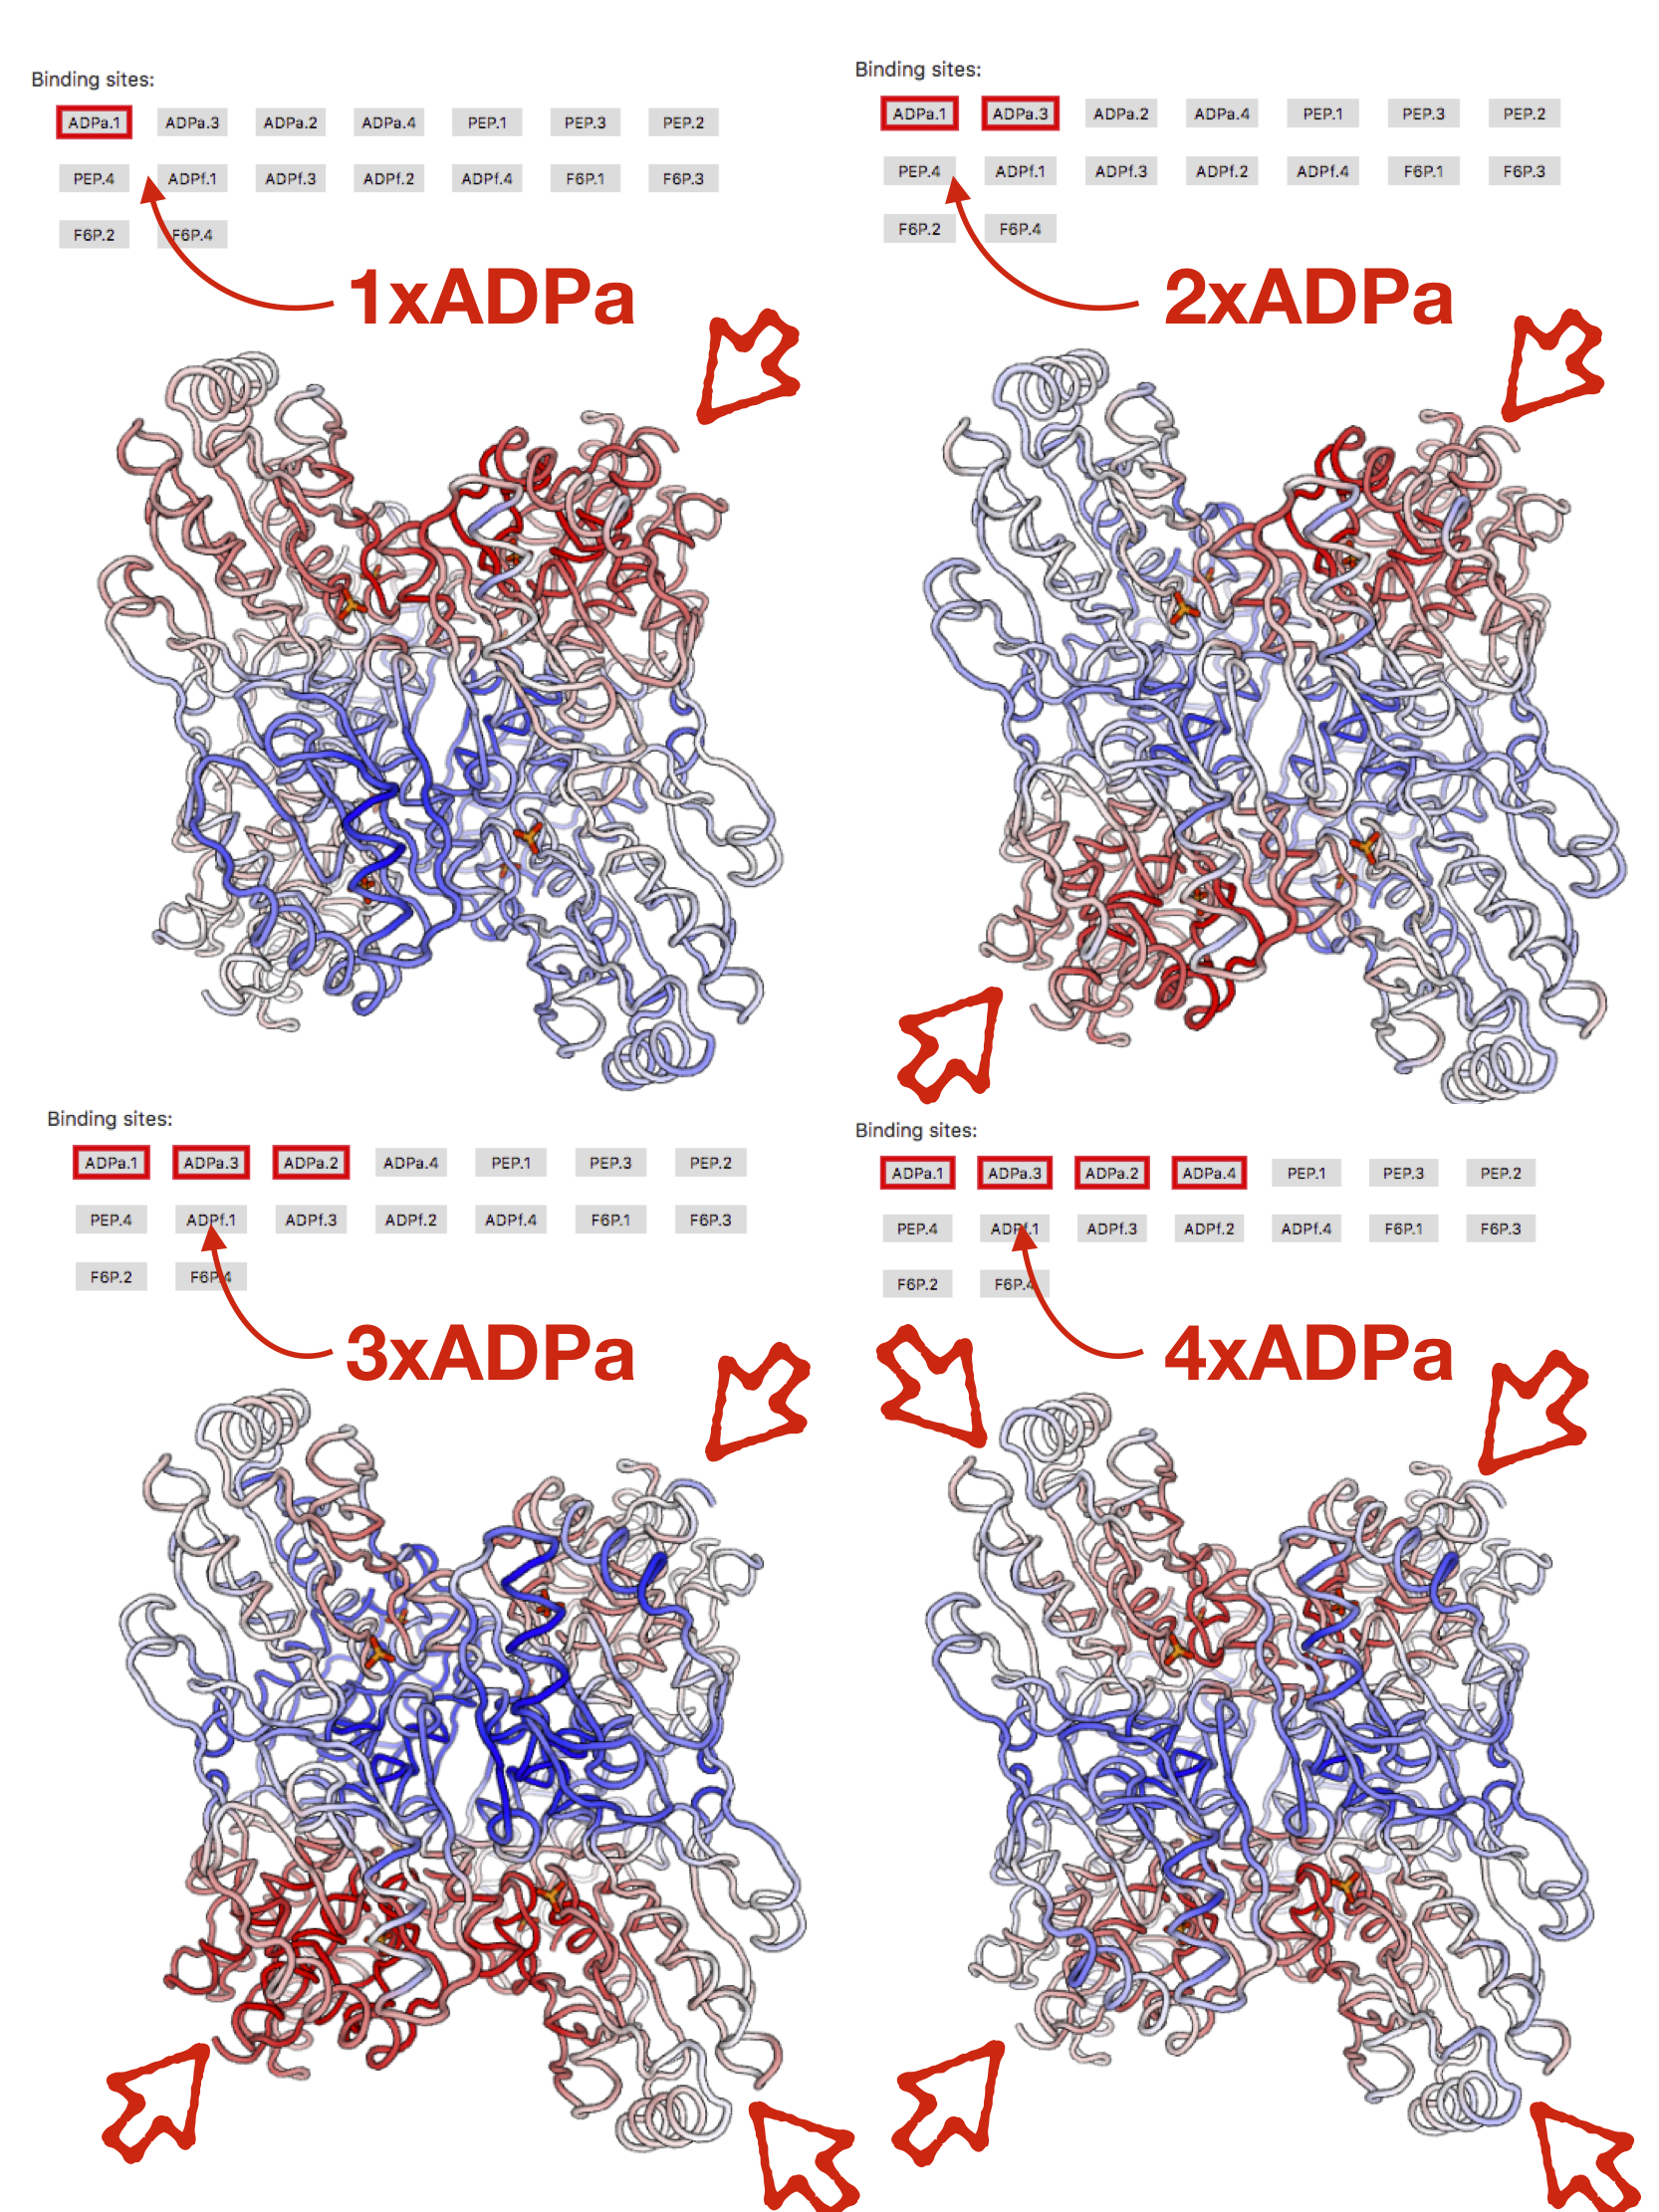
Figure 6: Binding to multiple ADPa sites in PFK.
In case of binding to multiple sites of the same type, the loaded modulation data is a result of actual calculations where the binding sites were perturbed together. When the effect of binding to sites of different types is analysed, the modulation data are obtained by superimposing the modulations from individual sites. For example, given two sites A and B, the combined modulation initiated by these sites is: .
The allosteric modulation detected on sites as a result of the binding to a selected site(s) can be accessed by clicking the button "Show effects on sites". The pop-up window will emerge with the data values of allosteric modulations per site type (see example shown in Figure 7).
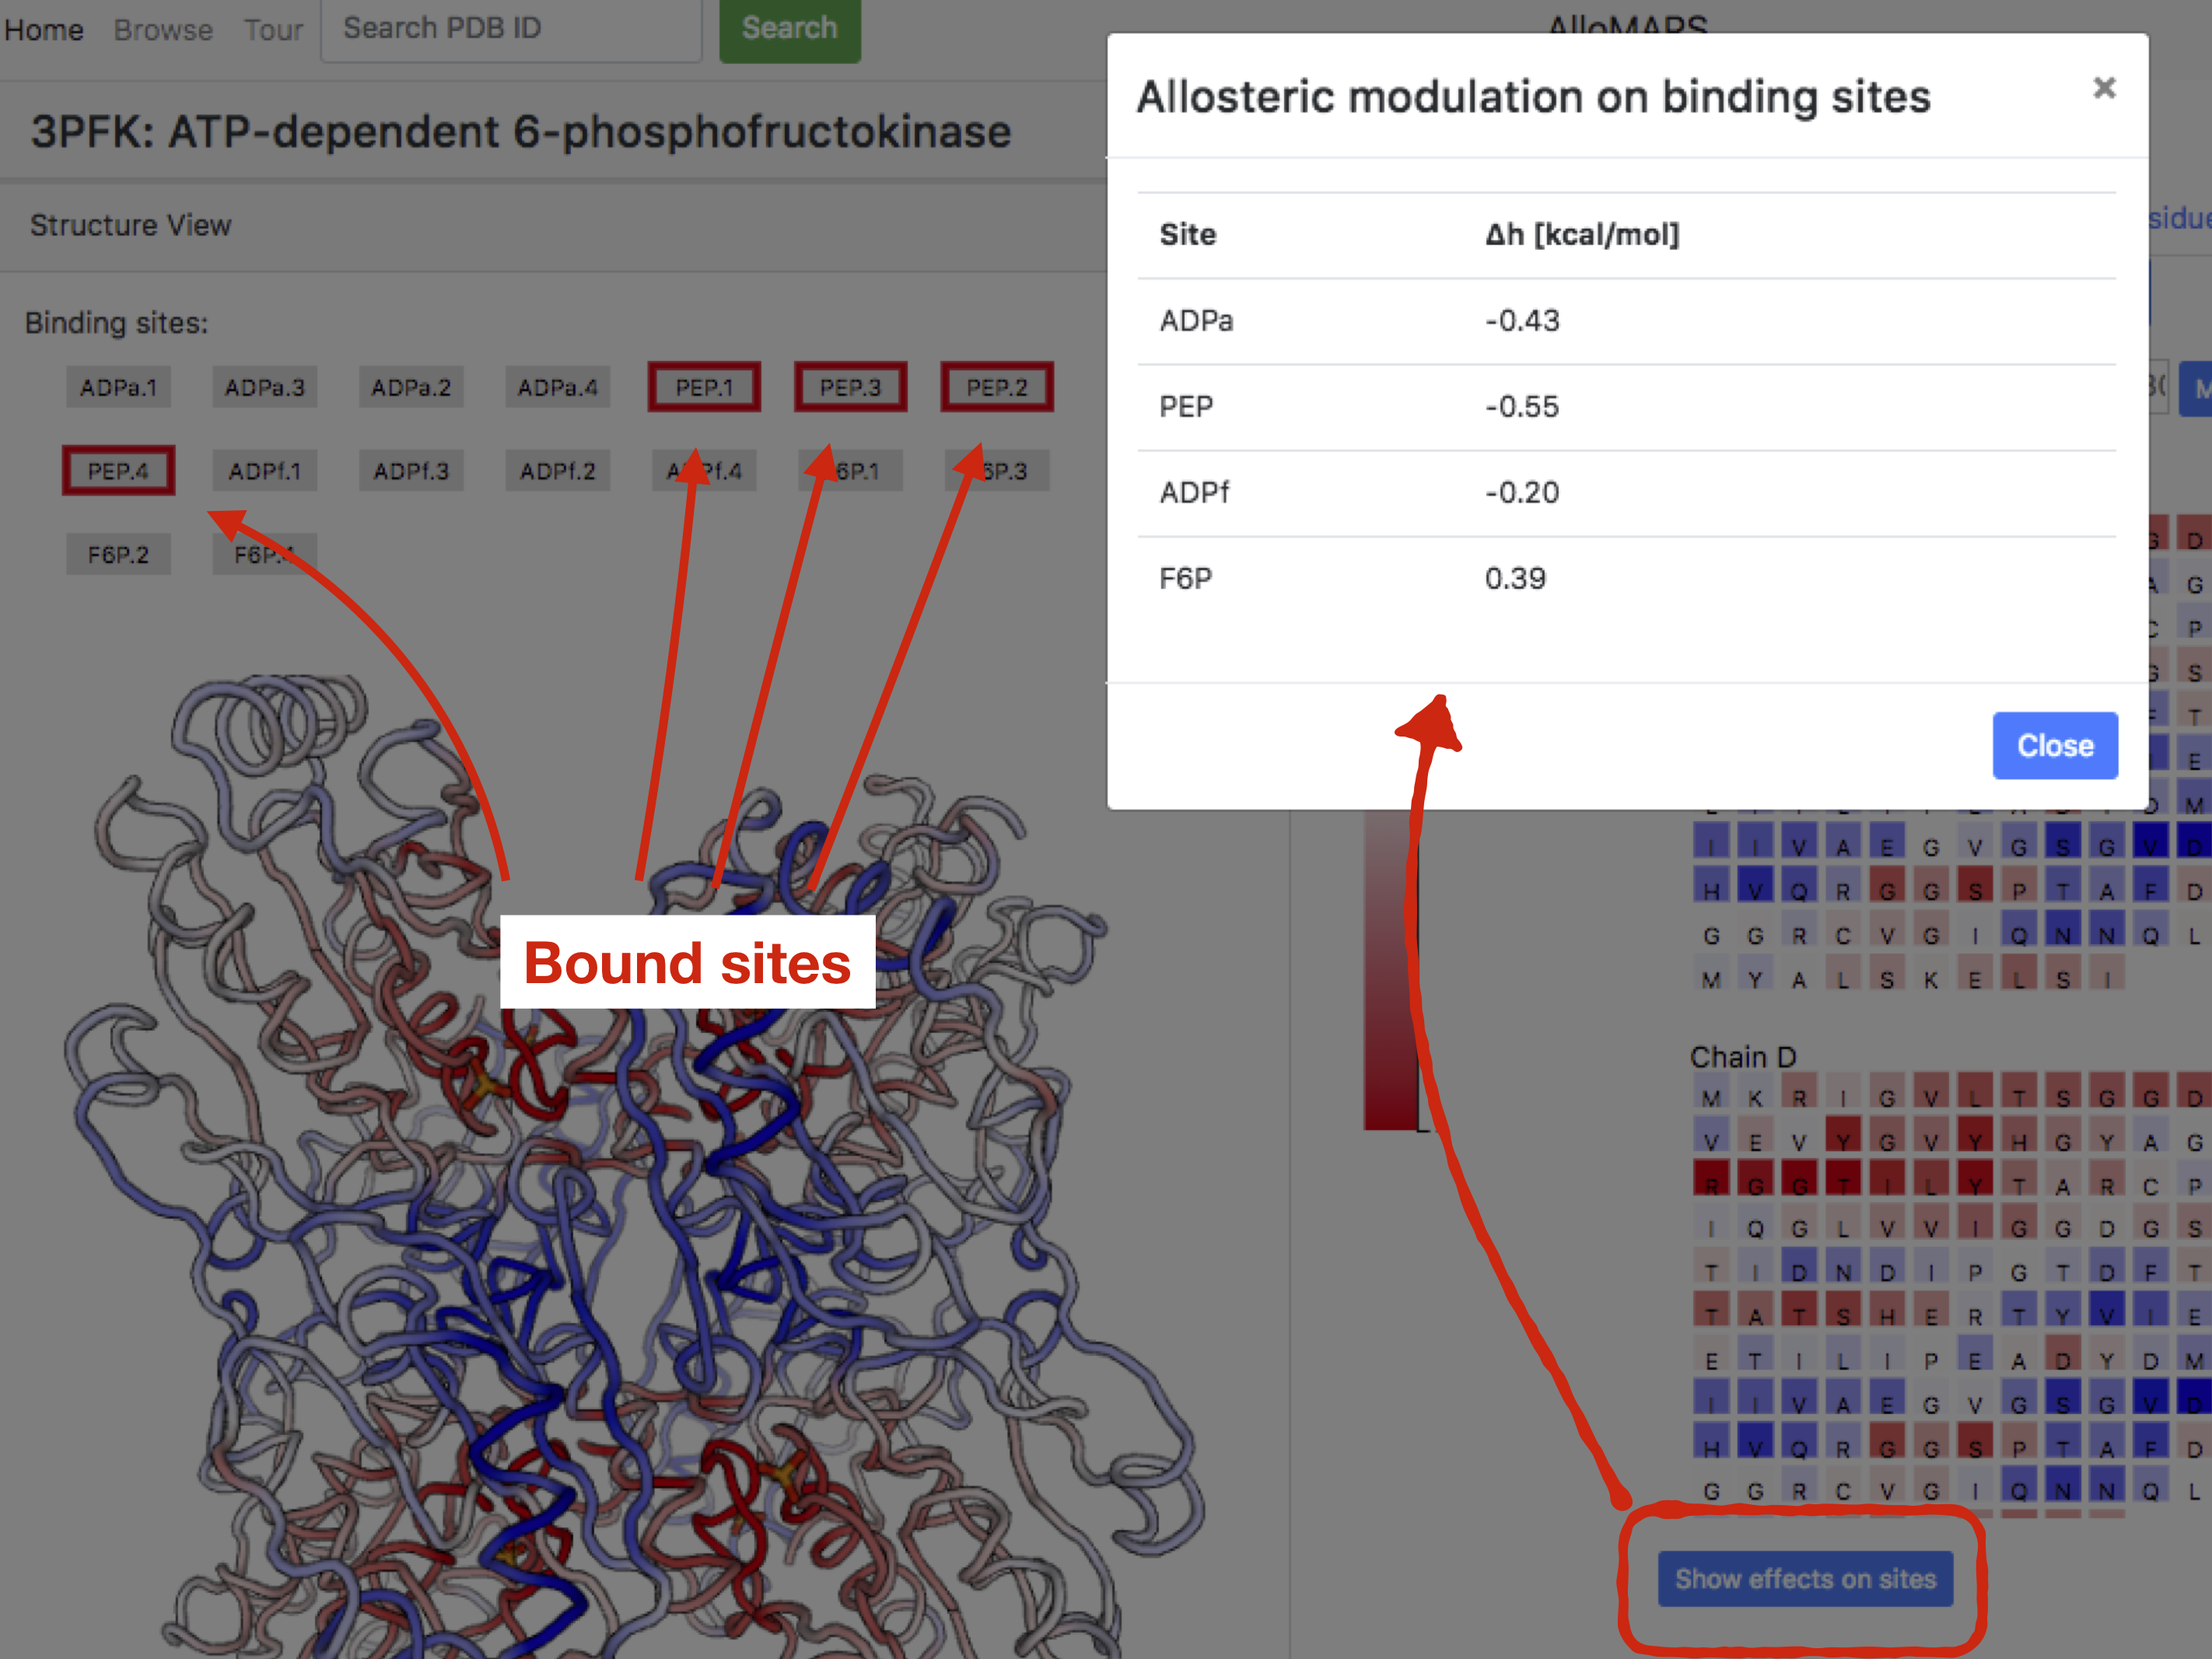
Figure 7: Allosteric modulation on binding sites, example of PFK
in the case of 4xPEP sites perturbed.
The effects of binding to multiple sites can be also visualized in a network representation by clicking the last tab "Sites: Binding" on the right side of the page. Upon choosing this option, the list binding site is shown along with buttons corresponding to the number of sites that can be bound. Figure 8 shows cases of binding to one, two, three, and four PEP sites in PFK. Upon clicking the button corresponding to the number of bound sites, the user obtains a directed graph, which should be dragged in the middle of the panel in order to be fully visible. Nodes of the graph represent the site types, while links connect the perturbed sites with the others, the numbers show allosteric modulation detected at the sites as a result of the binding to the site of interest (effects of binding to PEP site(s) are illustrated in Figure 8). Arrows indicate positive modulation, and bases negative modulation. The reported values of modulation that correspond to a selected number of bound sites are averaged over all those obtained for protein states with this number of bound sites. For instance, in PFK there are four PEP sites available, one per chain. The allosteric modulation caused by perturbation of one PEP site is obtained by averaging over four possible protein states in which one of the four PEP sites is liganded (see also illustration in Figure 8). In case of perturbation of two PEP sites, the allosteric modulation is averaged over six possible protein states with two liganded sites. In general, given the total number of available binding sites N, the allosteric modulation corresponding to M < N perturbed binding sites is averaged over the binomial (N,M) of partially perturbed protein states.
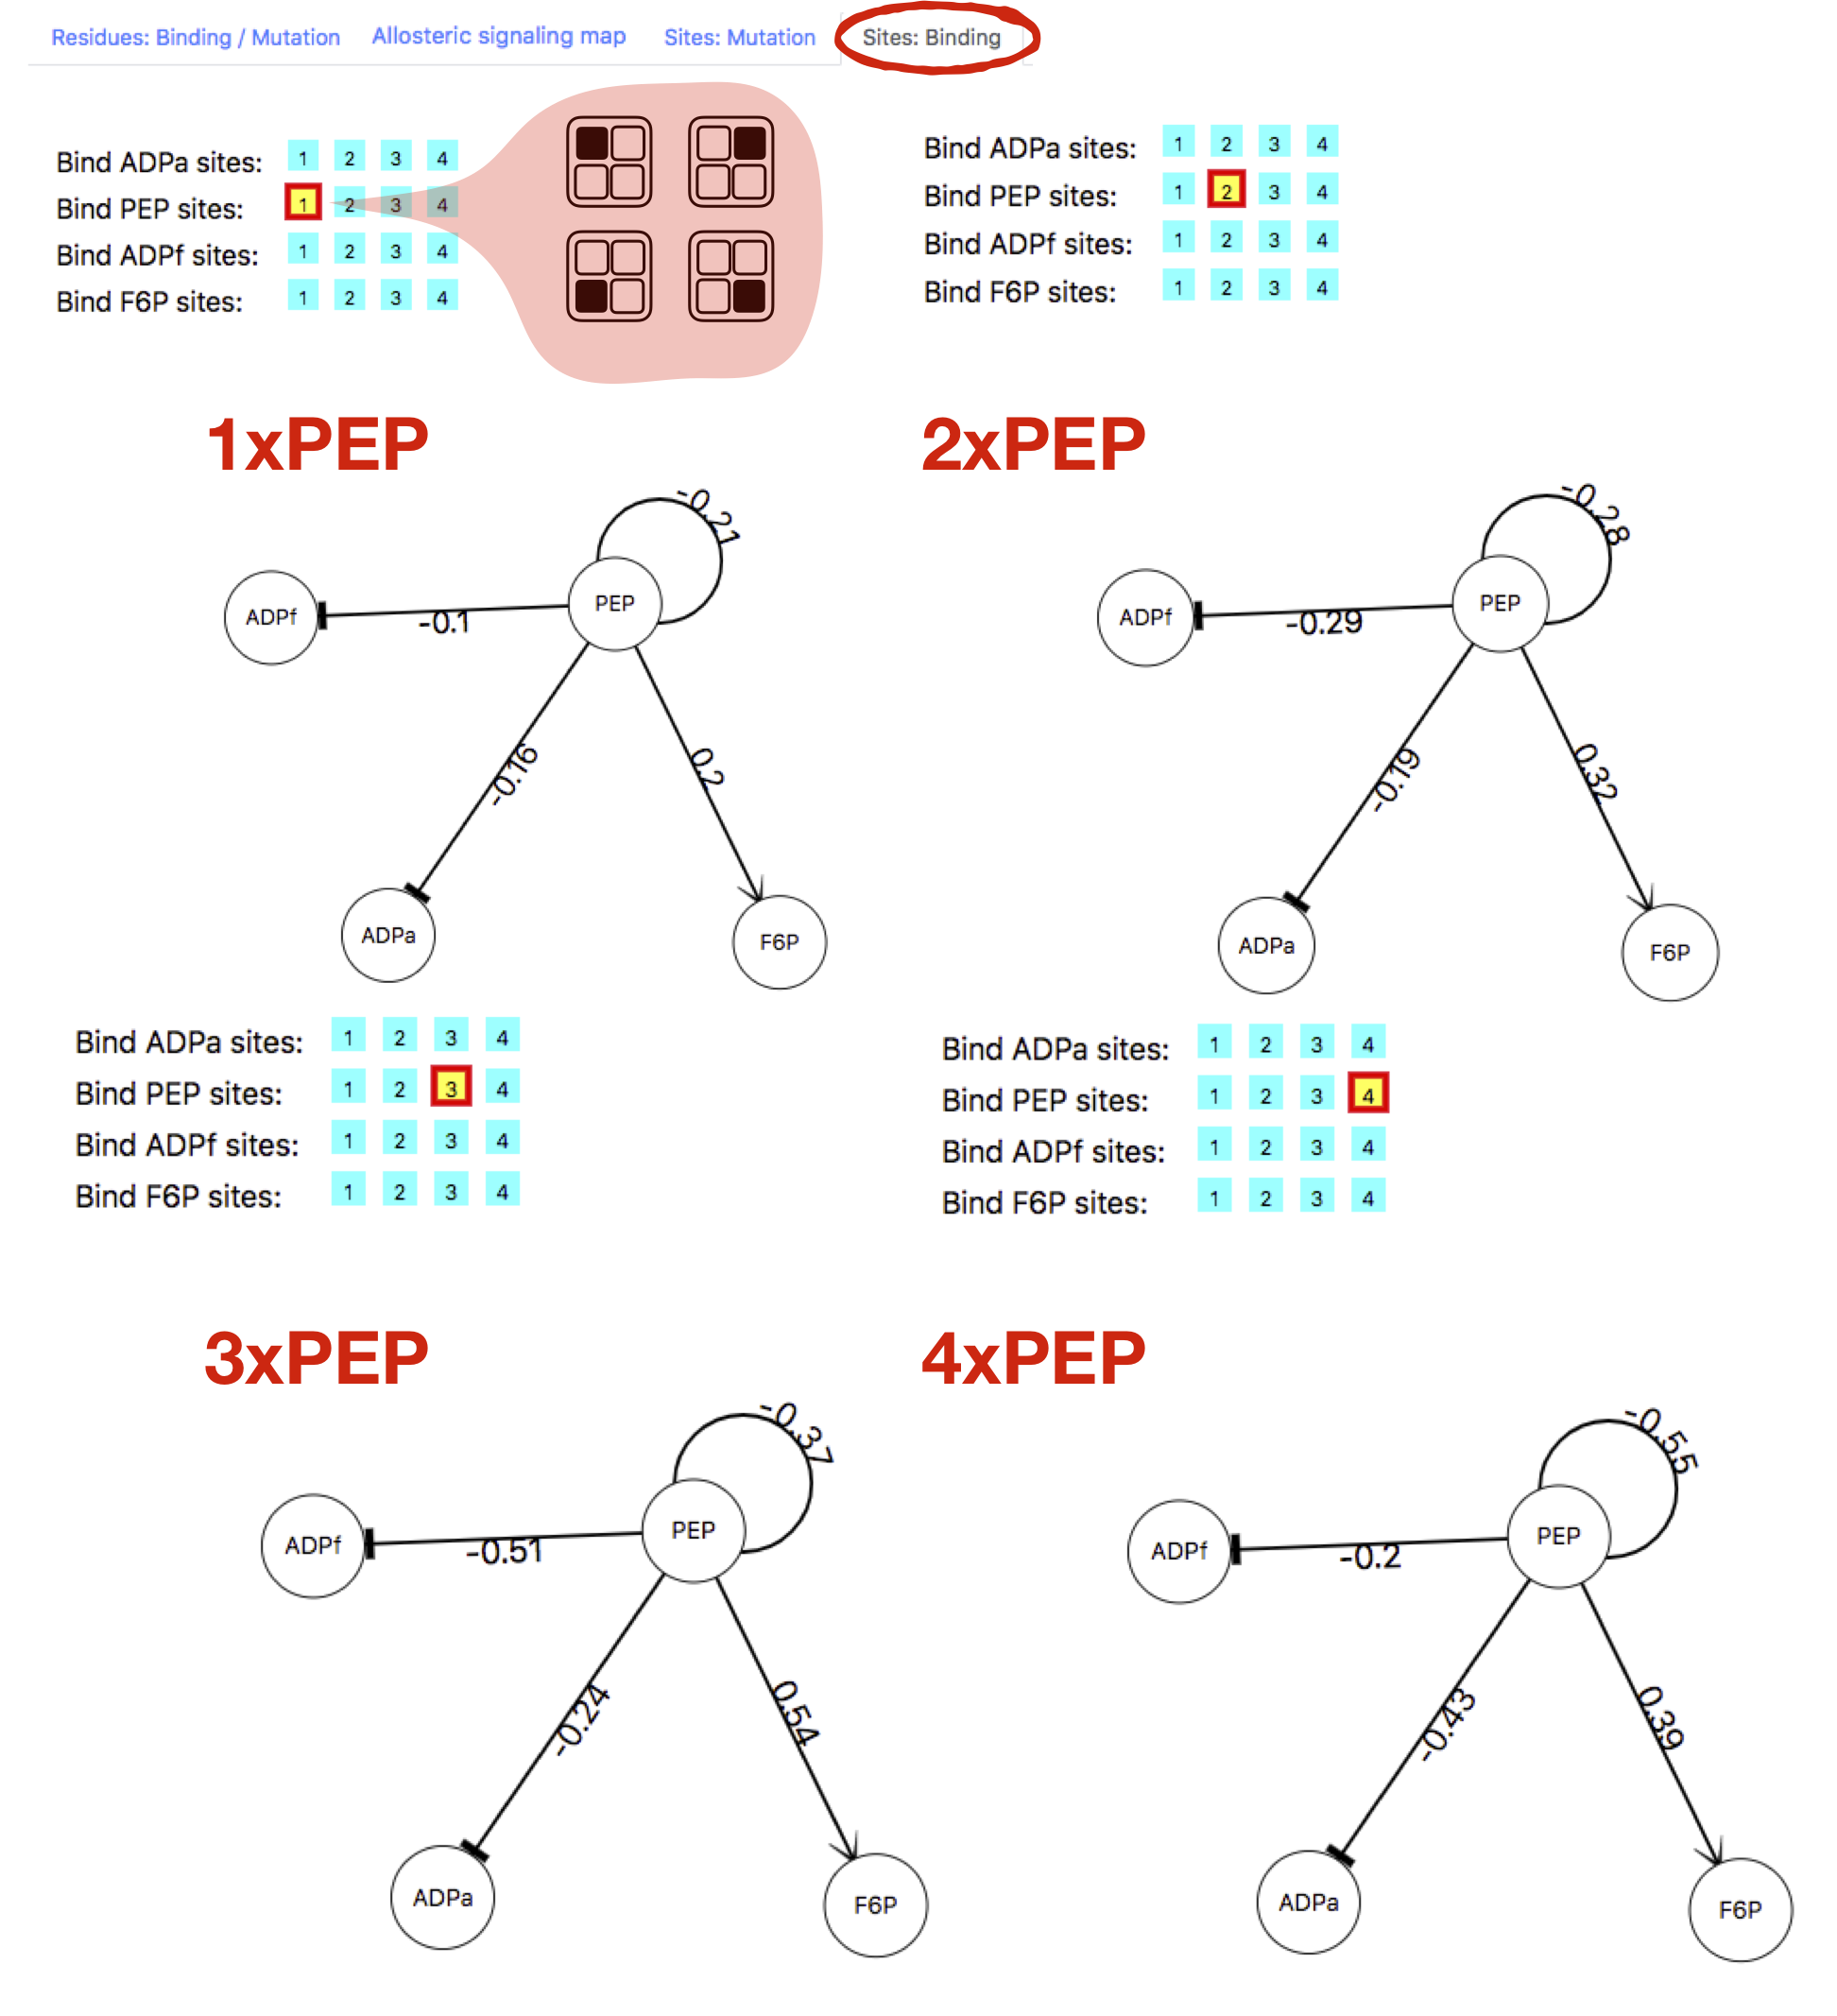
Figure 8: Graph representation of the allosteric modulation on the sites.
Mutations
The full scanning of single residue UP/DOWN mutations was performed in all the proteins of the database. Upon selecting a protein from the list of Allosteric proteins (PFK in Figure 3), the data for stabilizing (UP) mutations data are loaded under the "Residues: Binding/Mutations" tab automatically. The dataset on destabilizing (DOWN) mutations can be accessed by clicking the “DOWN: button. Mutation scanning data can be visualized in terms of the Allosteric Signaling Maps (ASMs, [7]), which are matrices depicting the allosteric signaling and the energetics associated with all possible pairs of residues, consisting of the mutated (y-axis) and responding (x-axis) residues. By clicking the tab "Allosteric Signaling Maps", ASM is visualized for the selected protein and the selected mutation dataset (either UP, DOWN, or "Modulation range"). In the "Modulation range" dataset, a generic description of the allosteric effect of the amino acid substitution in a protein position — difference between the responses caused by mutation in a certain protein position from the smallest (Ala/Gly-like) to bulkiest amino acids — is provided.
Figure 9 contains screenshots of ASMs for UP and DOWN mutations, and for the modulation range obtained for PFK. The ASM can be explored by zooming in and out of the matrix. At the bottom of the same page, the matrix of the inter-residue distances is also visualized to guide the eye in interpreting the information contained in the ASM in relation to the structure and distances between allosterically communicating parts/residues of the protein. The user can make a rectangular selection of a part of ASM and blow up this region to observe details of signalling. This procedure can be repeated, allowing to select smaller parts of the ASM.
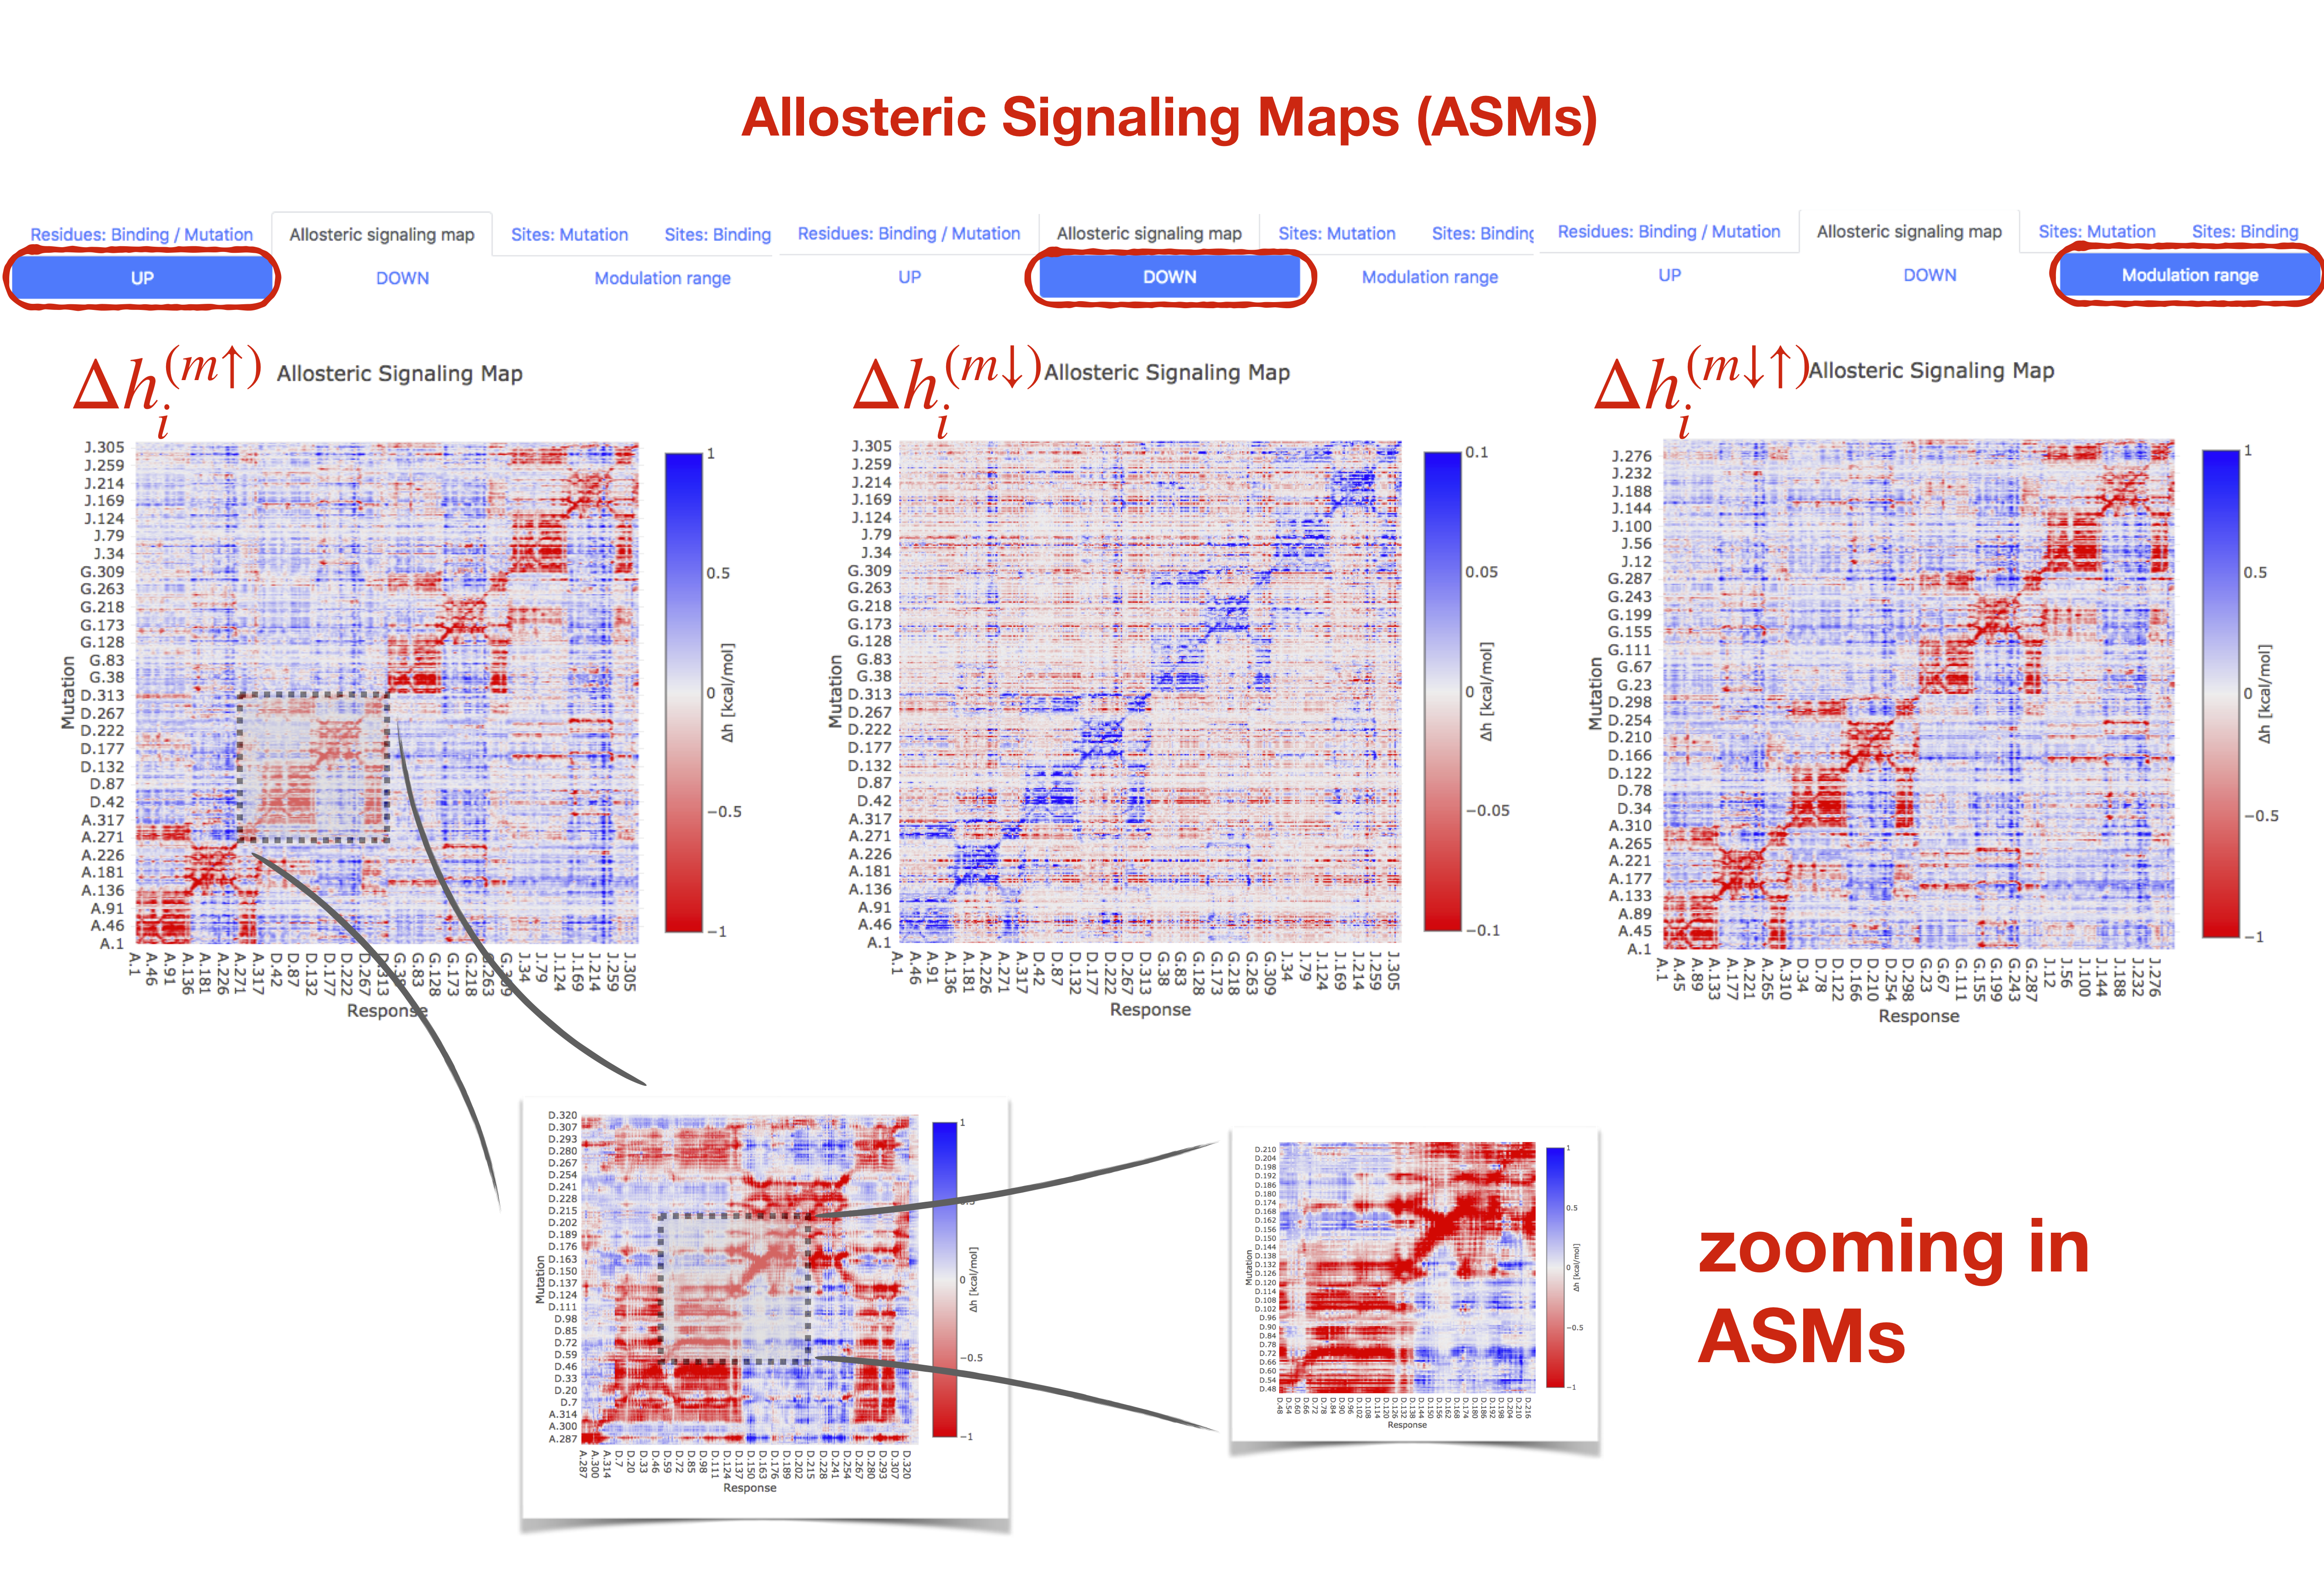
Figure 9: Allosteric Signalling Maps (ASMs) for UP and DOWN mutations, and modulation range in PFK.
Blow up of the ASM part can be performed and repeated several times
for obtaining local details of signalling.
The effect of single-residue mutations can be accessed by clicking residue of interest in the sequence panel within the "Residues: Binding/Mutations" tab. The effect of the mutation is visualized in both structure view in the left panel and in the sequence view on the right side. The actual values of modulation on specific residues can be visualized by pointing the mouse on the residue of interest. Similarly, as with the case of ligand binding, the modulating effect of mutation on sites can be assessed by clicking the "Show effects on sites" button. Multiple mutations can be chosen by either on several residues in the sequence panel or by manually inserting a list of residues (see Figure 10). Modulation obtained from the single-residue mutation is a result of an actual calculation, whereas effects of multiple mutations are obtained by superimposing the modulatory effects of single-residues mutations. The general function for highlighting protein positions that undergo stronger/weaker than average modulation is provided via the buttons "High 𝛥ℎ", "Low 𝛥ℎ", and "Clear highlight" in the bottom of the right panel. The function is described in detail below and illustrated in Figure 12.
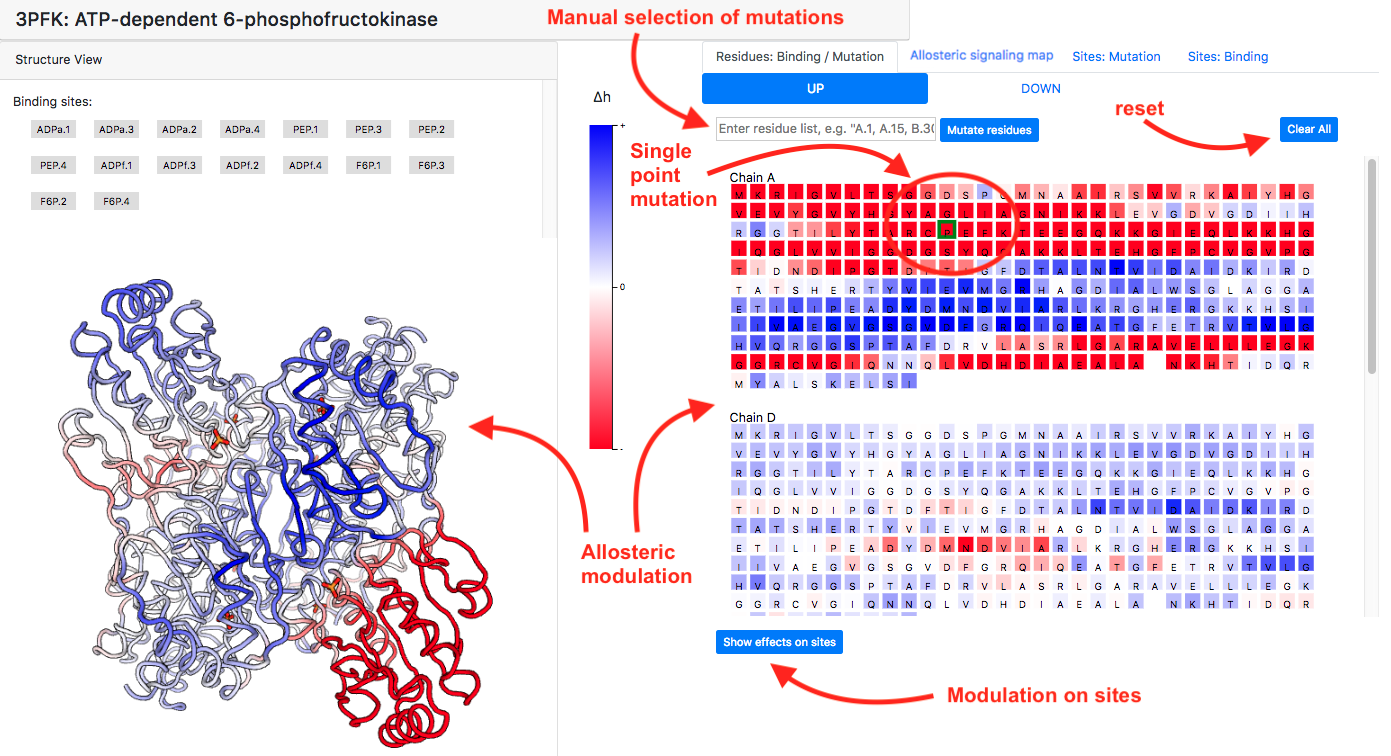
Figure 10: How to select mutations and visualize their effects.
Effects of binding and mutations can be combined in a simple way by clicking on the binding sites on the left panel and selecting the residues to be mutated. The type of mutations should be chosen in advance, and only one type of mutations (UP or DOWN) can be analysed at one time together with ligand binding.
Similarly, as with previous cases, the combined modulations due to binding and mutations are obtained by superimposing the individual effects of binding and mutations. Figure 11 shows an example of such combined modulation in PFK, where ligand binding to four PEP sites is complemented by four UP-mutations of residue Val54 in each of the four protein chains. The effect of these mutations on sites can be visualized by clicking on the button "Show effect on sites", which in case of F6P shows a dramatic increase of allosteric modulation (2.19 kcal/mol vs. 0.39 kcal/mol for the wild-type case).
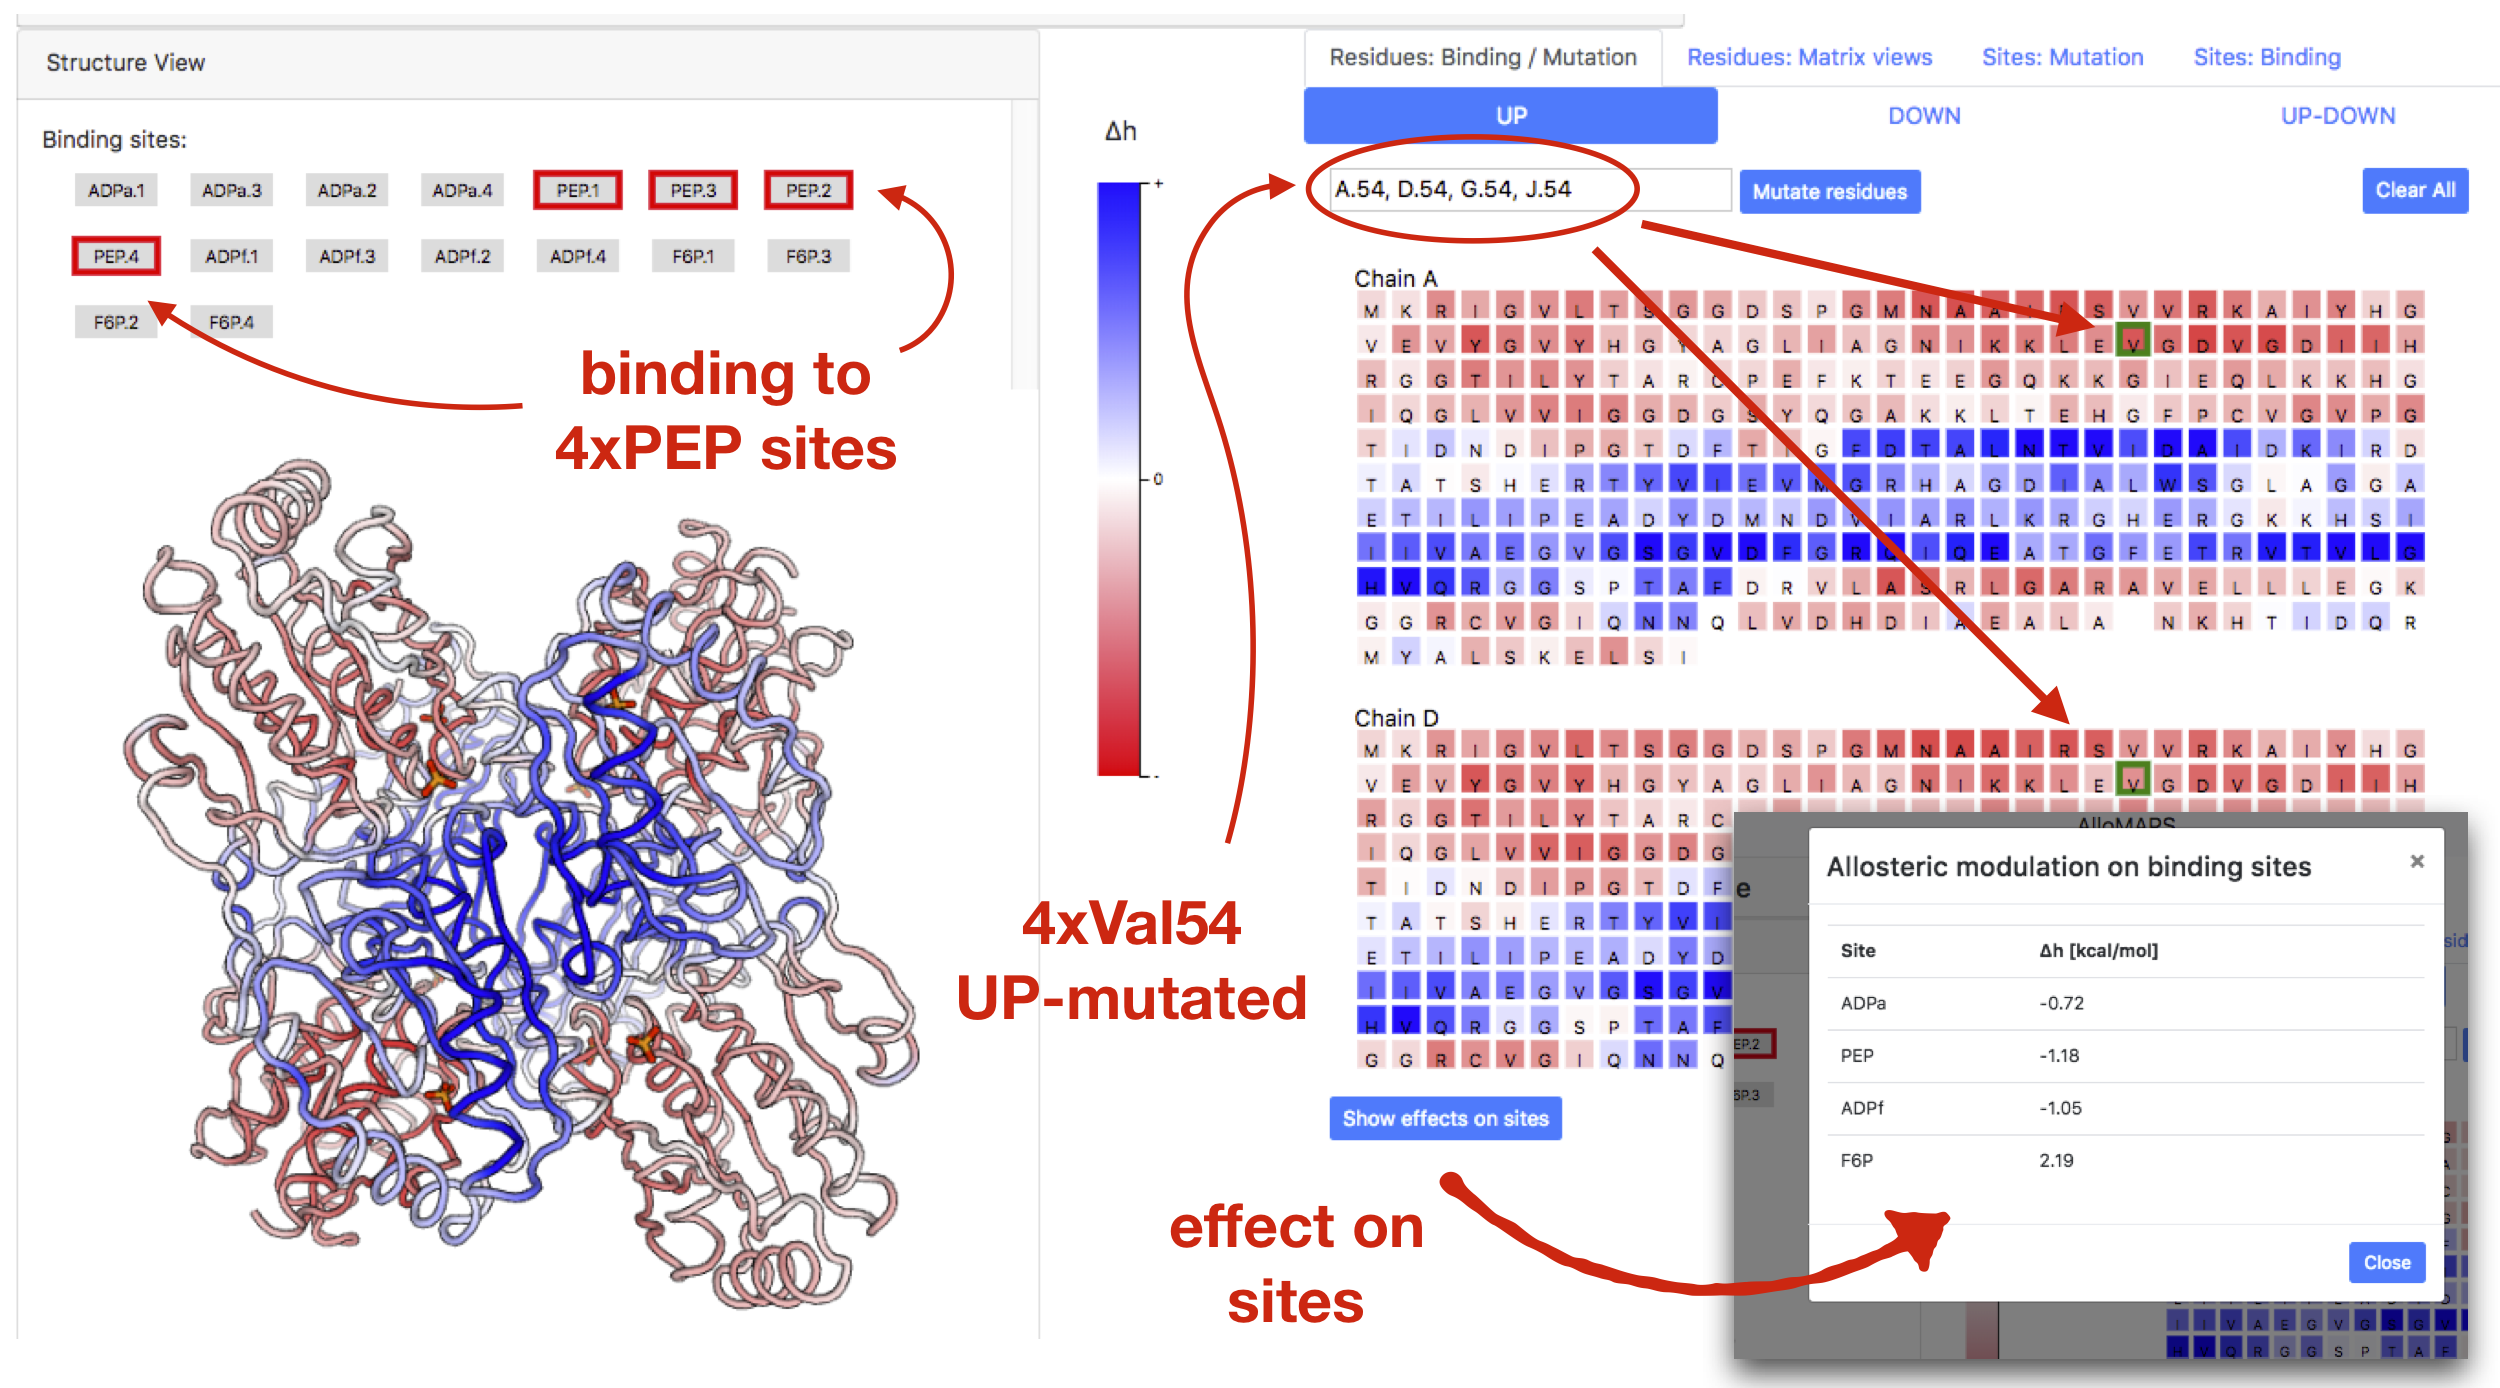
Figure 11: Example of modulation caused by the binding and mutations combined together in PFK:
ligand binding to four PEP sites is combined with UP-mutations
of residue Val54 in all four chains of PFK.
There is a possibility to monitor an effect of allosteric modulation on the sites as a result of mutations accessible via the "Sites: Mutations" tab, which opens a with sequences of protein chains along with buttons designating site types that are present in the protein. Clicking on one of the site types will load the single-residue mutation data for either UP or DOWN mutations. The left panel of Figure 12 shows allosteric modulation of the substrate site ADPf upon single-residue UP-mutations. Each residue position in the sequence is colored according to the averaged modulation experienced by the ADPf sites as a result of UP-mutating the residue in that location. By pointing the cursor on the residue position user can see the value of modulation in kcal/mol. Additionally (not shown in Figure 12, but present in the actual page), there is a panel on the left side of the page with the structure colored according to the allosteric modulation of the site.
There is a general function for highlighting sequence positions that show high/low values of the modulatory effects. There are three buttons in the bottom of the sequence panel: "High ", "Low ", and "Clear highlight" (see right panel in Figure 12). By clicking "High " residues with modulation , with the standard deviation of the modulation distribution, are highlighted in orange; alternatively, clicking "Low " the residues with modulation are highlighted. The "Clear highlight" button removes highlights from the protein chain, allowing to start analysis again.
In case of the effect of mutations on the sites under the tab “Sites:Mutations” the “High/Low ” buttons show mutations that provide stronger or weaker than average modulation on the binding site of interest picked by the user. In case of the modulatory effects sites, mutations, and combinations of the ligand binding and mutations analysed in the “Residue: Binding/Mutations” the “High/Low ” buttons show protein positions affected stronger or weaker than average upon corresponding perturbations caused by the ligand binding and/or mutation(s).
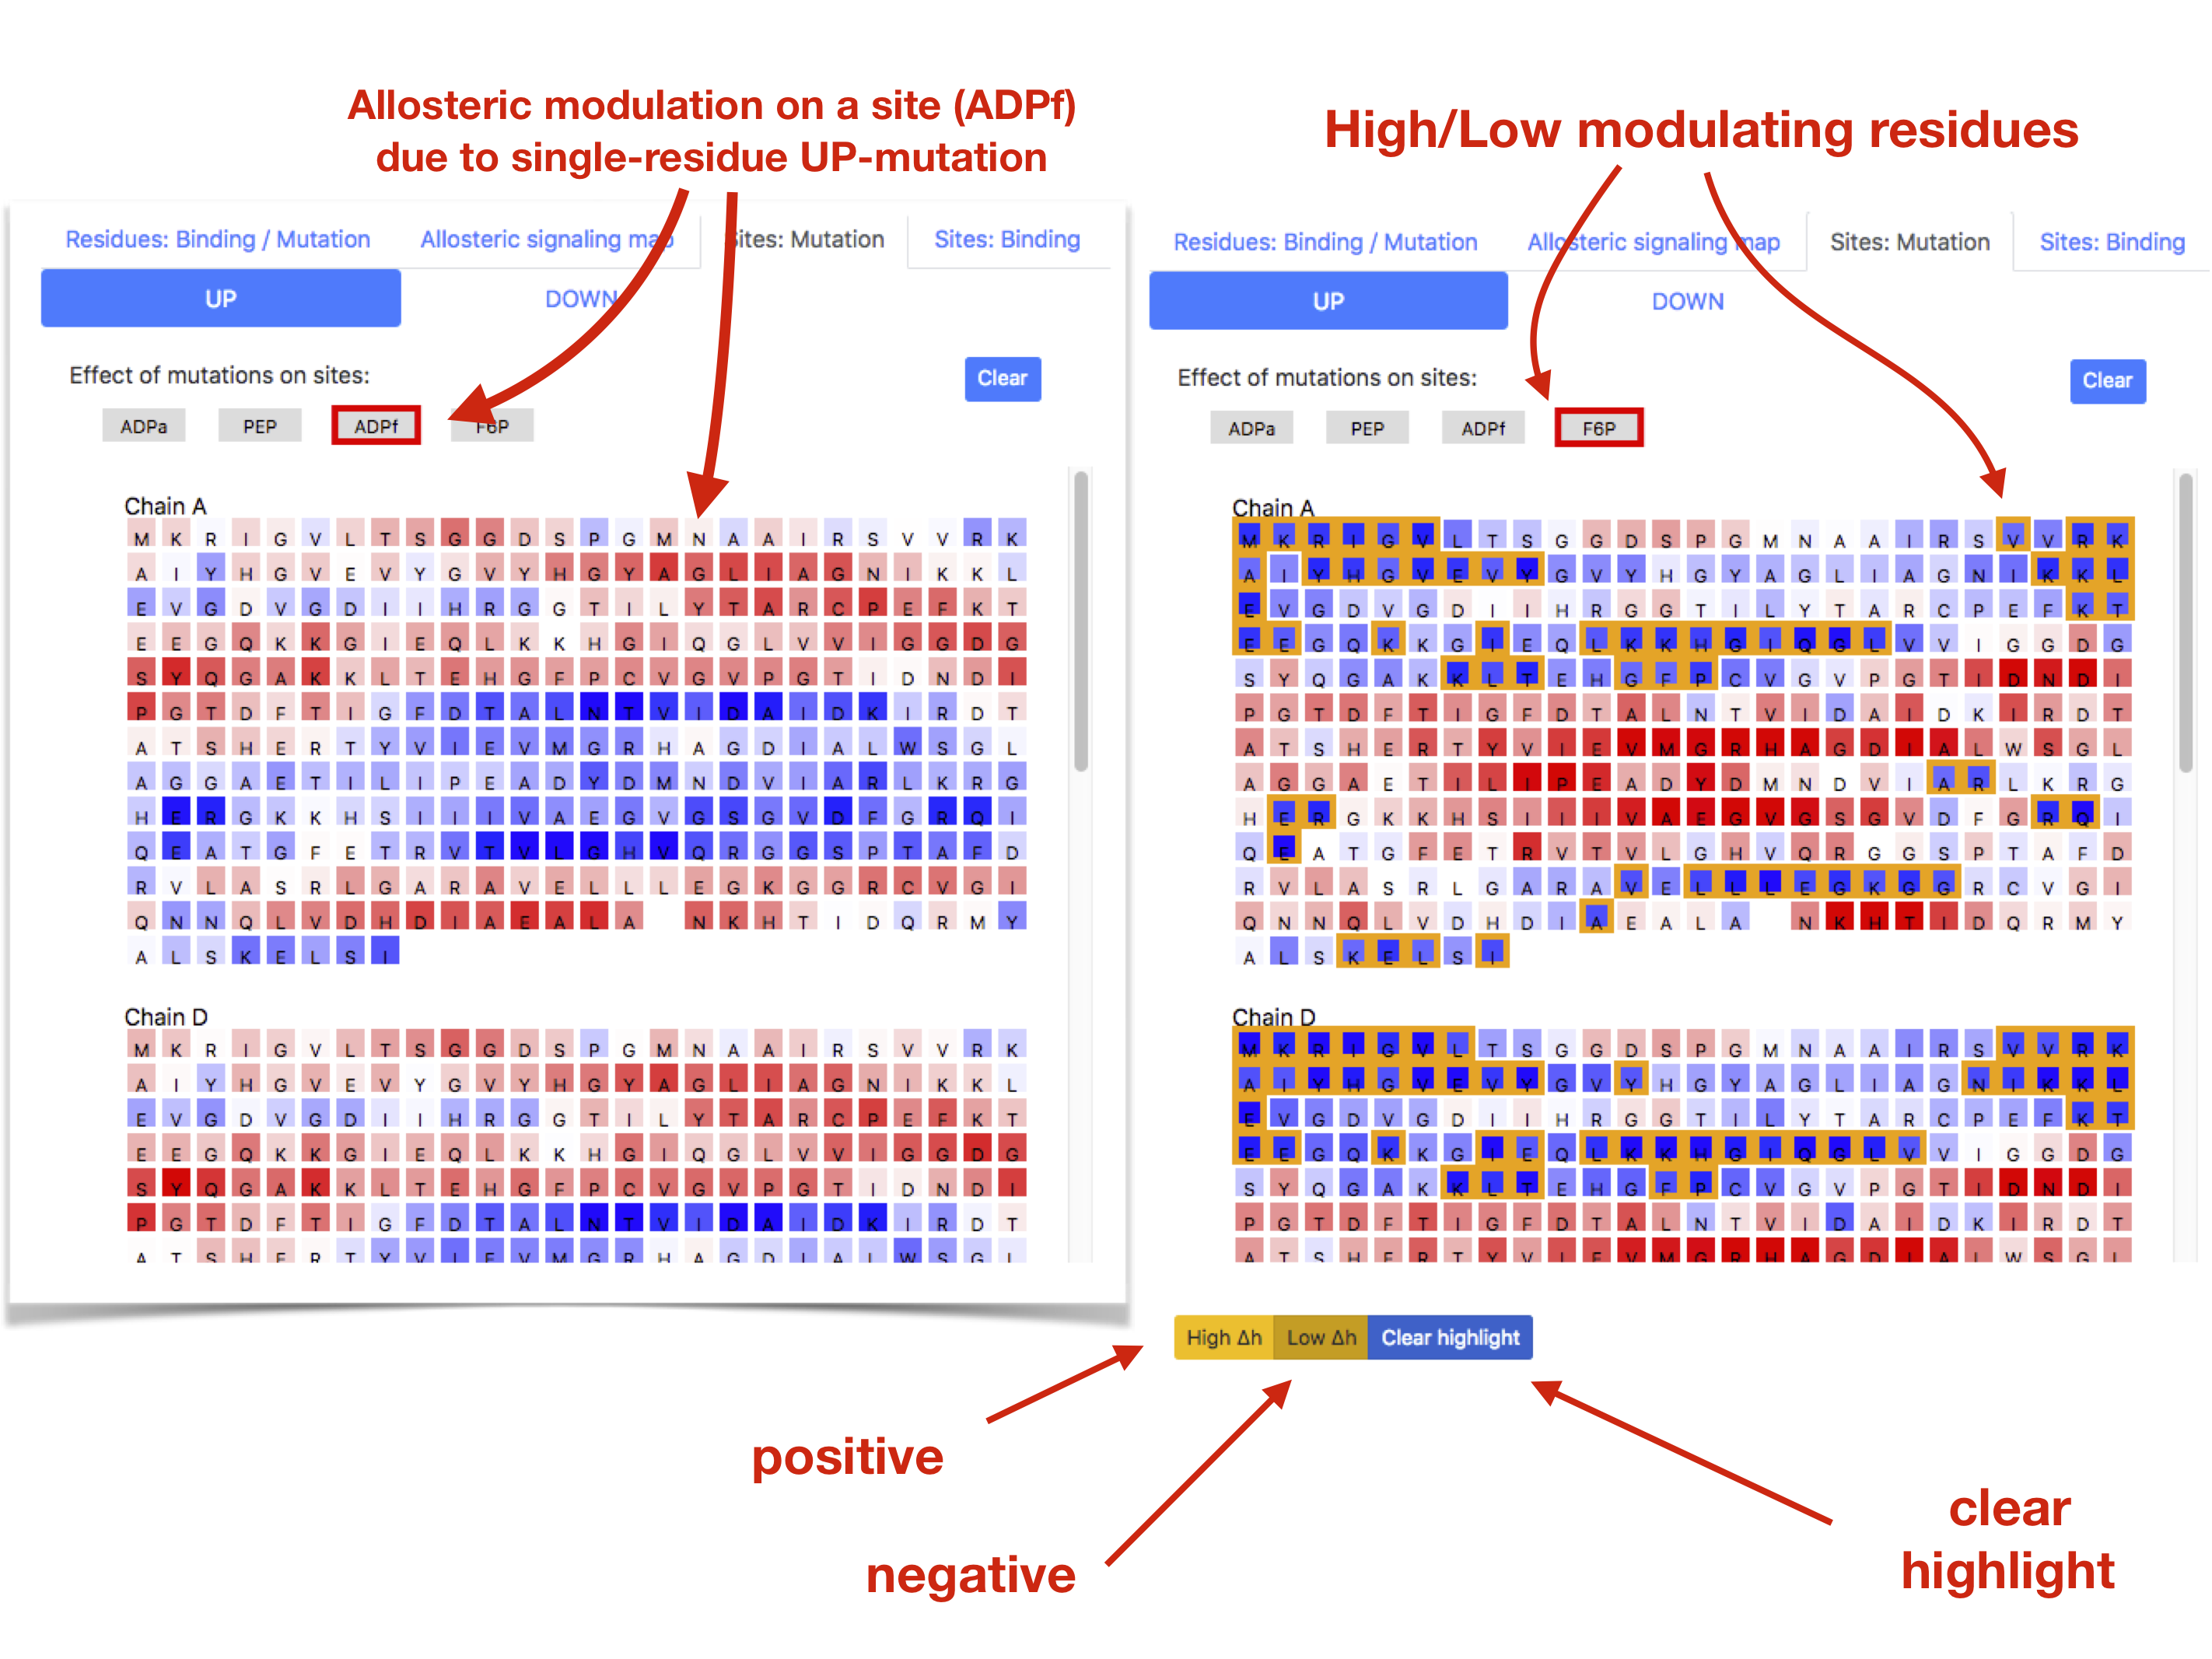
Figure 12: Examples of the allosteric effect of mutations on the binding sites (left) and of the generic function
for observing protein positions affected by or causing stronger/weaker modulation (right).
PDBselect chains
This part of AlloMAPS database describes allosteric signalling in 1908 protein chains from the PDBselect set of chains with low (less than 25%) sequence identity [1]. All chains are structurally annotated on the basis of CATH classification [2], and the “CATH classification wheel” serves for navigating the user through the set of chains. The Explore button in the "Structural folds" calls for the “CATH wheel” organized in four hierarchical levels, which allows user to access any of 1908 chains representing three protein classes (level 1), 13 architectures (level 2), 411 topologies (level 3), and 984 homologous superfamilies (level 4).
Full UP/DOWN mutation scanning was performed and Allosteric Signalling Maps (ASMs) with modulatory range data were obtained for all the protein chains in this dataset.
Using navigating “CATH wheel”, the user will access the Table with a list of protein chains belonging to required structural class, architecture, topology, and homologous superfamily (Figure 13). Each hierarchical level can be accessed directly in the navigating wheel. The table consists of six columns including: PDB ID, UNIPROT ID, Gene name, Protein name, Protein size, and CATH ID.
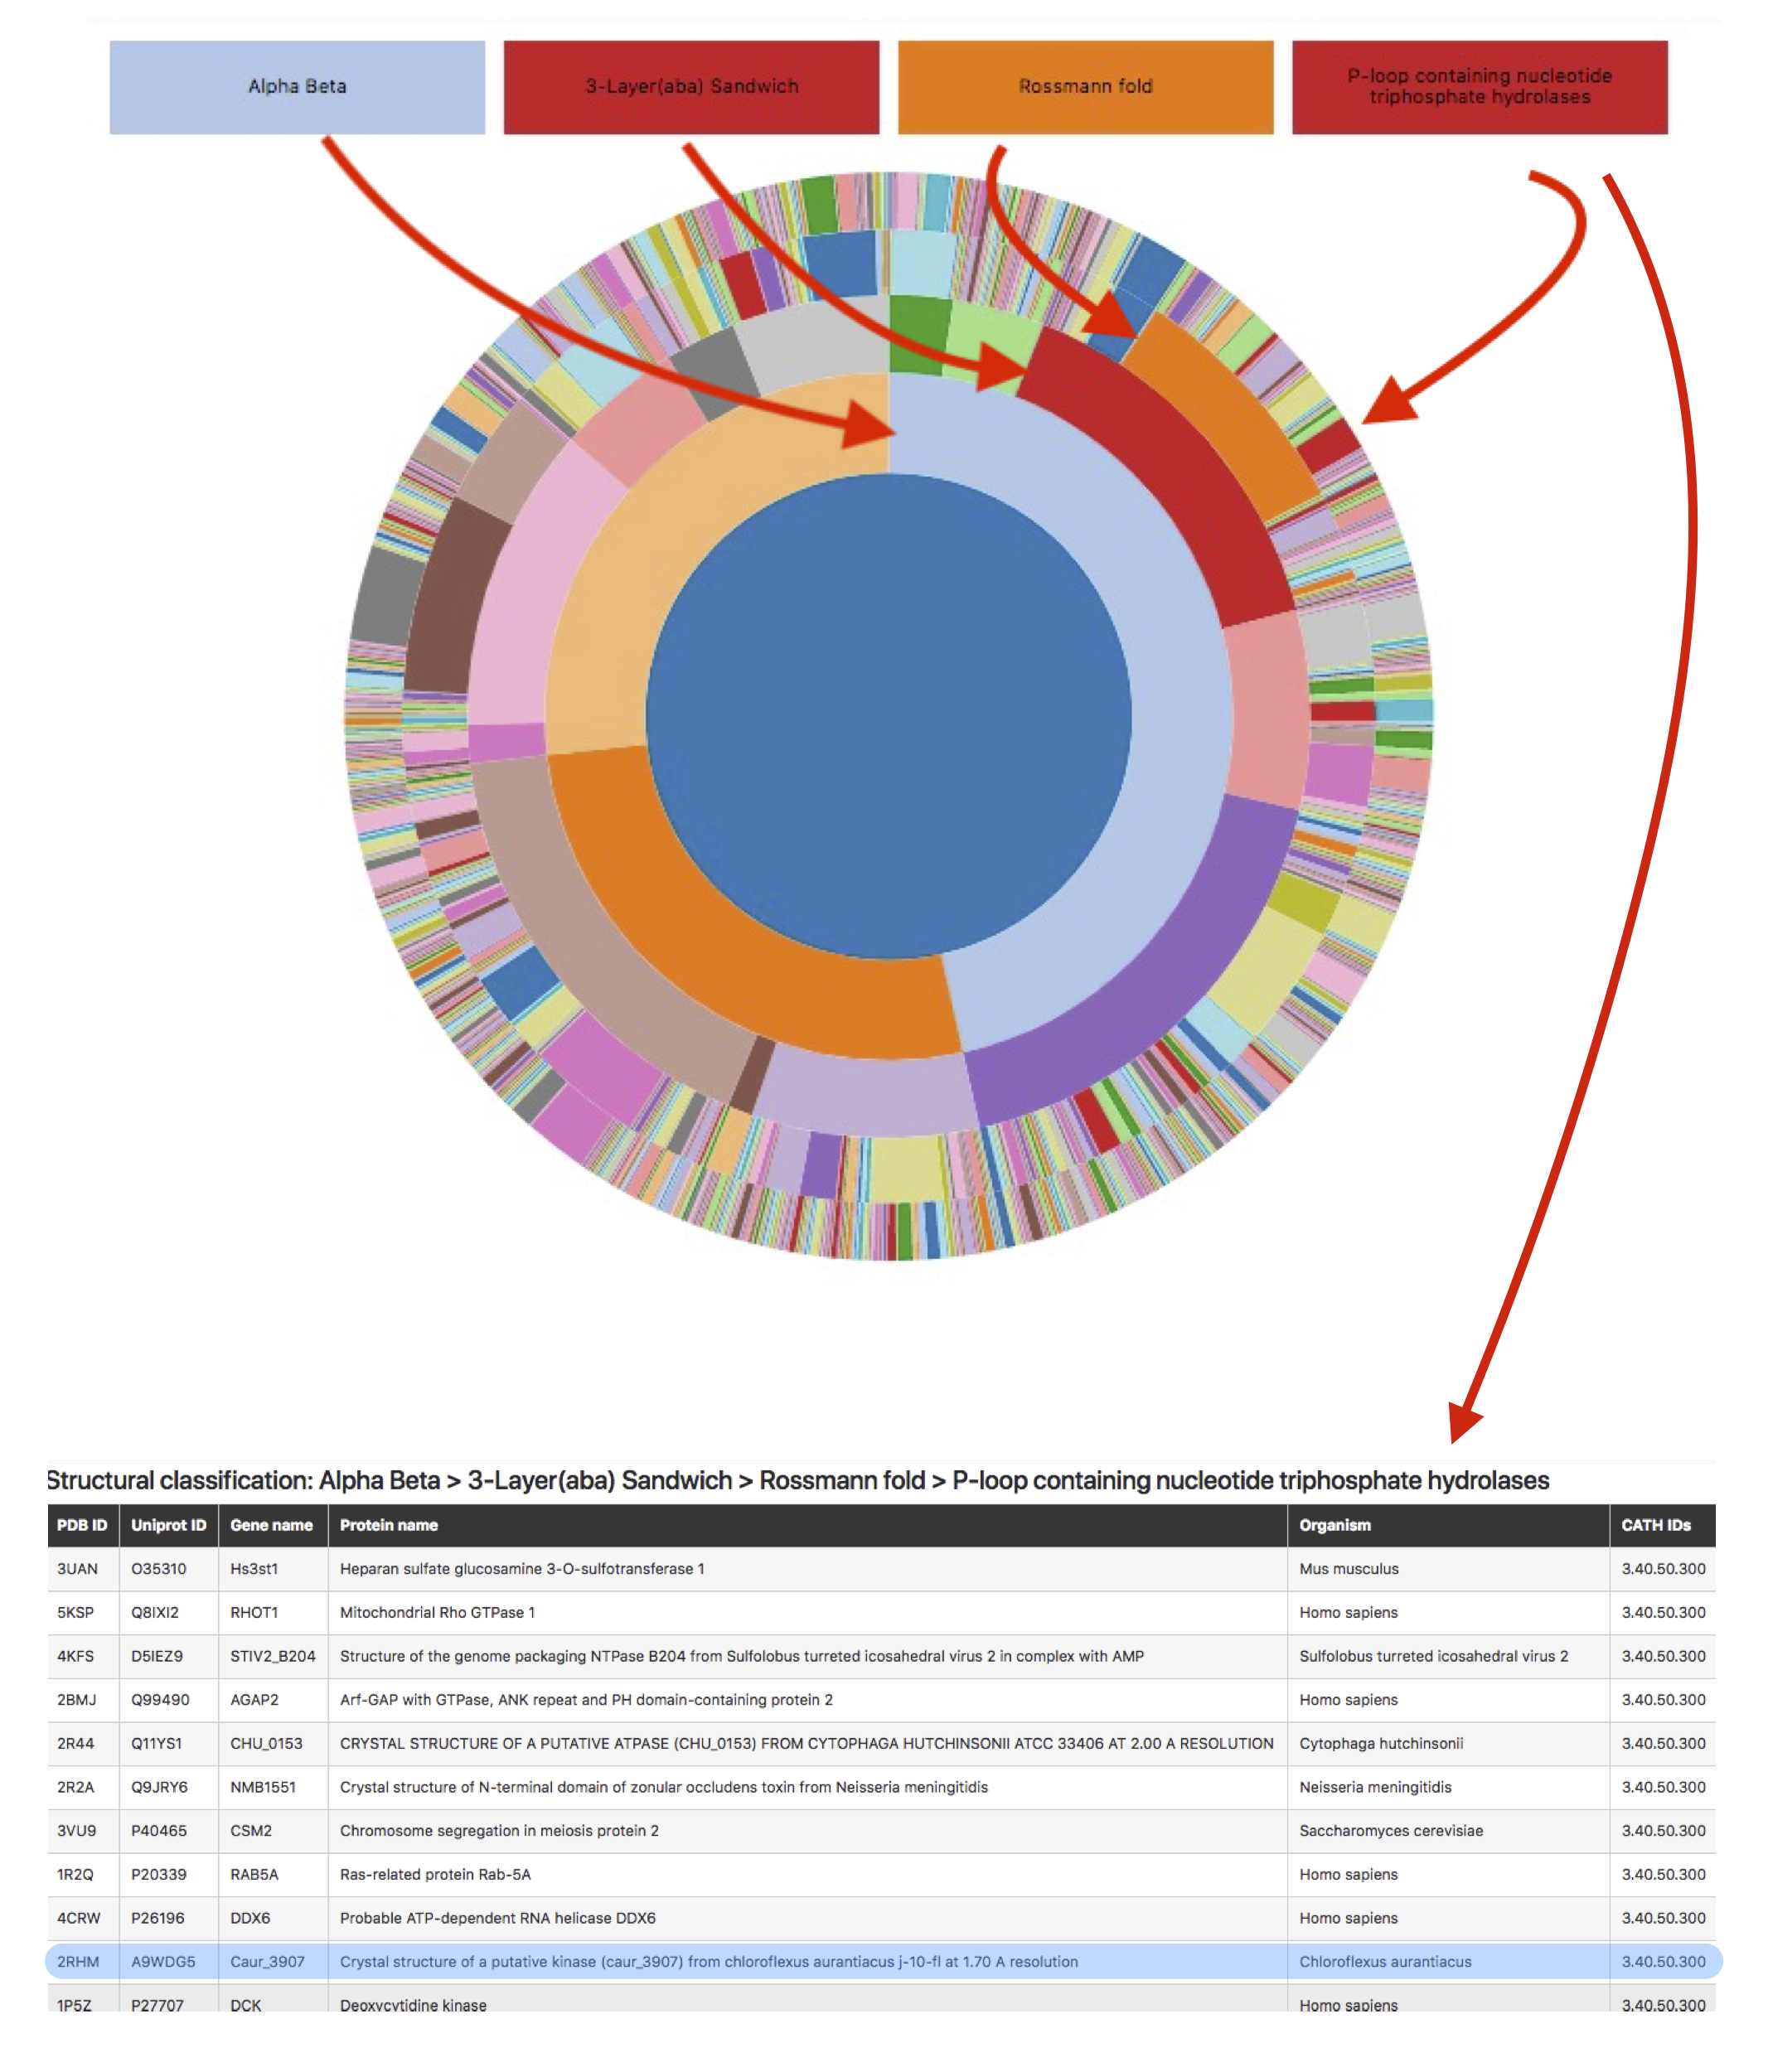
Figure 13: “CATH classification” navigating wheel leads to the list of protein chains with required structural characteristics.
The “PDBselect protein chain” page contains a structural representation of the protein (left panel) and its sequence (right). By designating the type of mutation (UP or DOWN), the user can require an output on the allosteric signalling originated by a corresponding mutation in any protein position by clicking on this position in the protein chain. Effects of multiple mutations can also be obtained by sequential clicking on the positions of interest. The colour gradient in the structural representation and in the sequence of the chain shows observed allosteric signalling. By moving the cursor over the position of interest, the user can obtain an allosteric free energy for this position upon mutation. Figure 14 shows an example of PDB ID: 2rhm chain with allosteric signalling caused by three UP mutations.
Allosteric Signalling Maps contain matrices obtained for UP/DOWN mutations and modulation ranges obtained for all residues of the chain upon total scanning of mutations in the analysed protein chain (exemplified in the bottom right of Figure 14). The ASM can be accessed via the tab “Allosteric Signalling Map”, then corresponding matrix (UP/DOWN mutations or modulation range) can be selected.
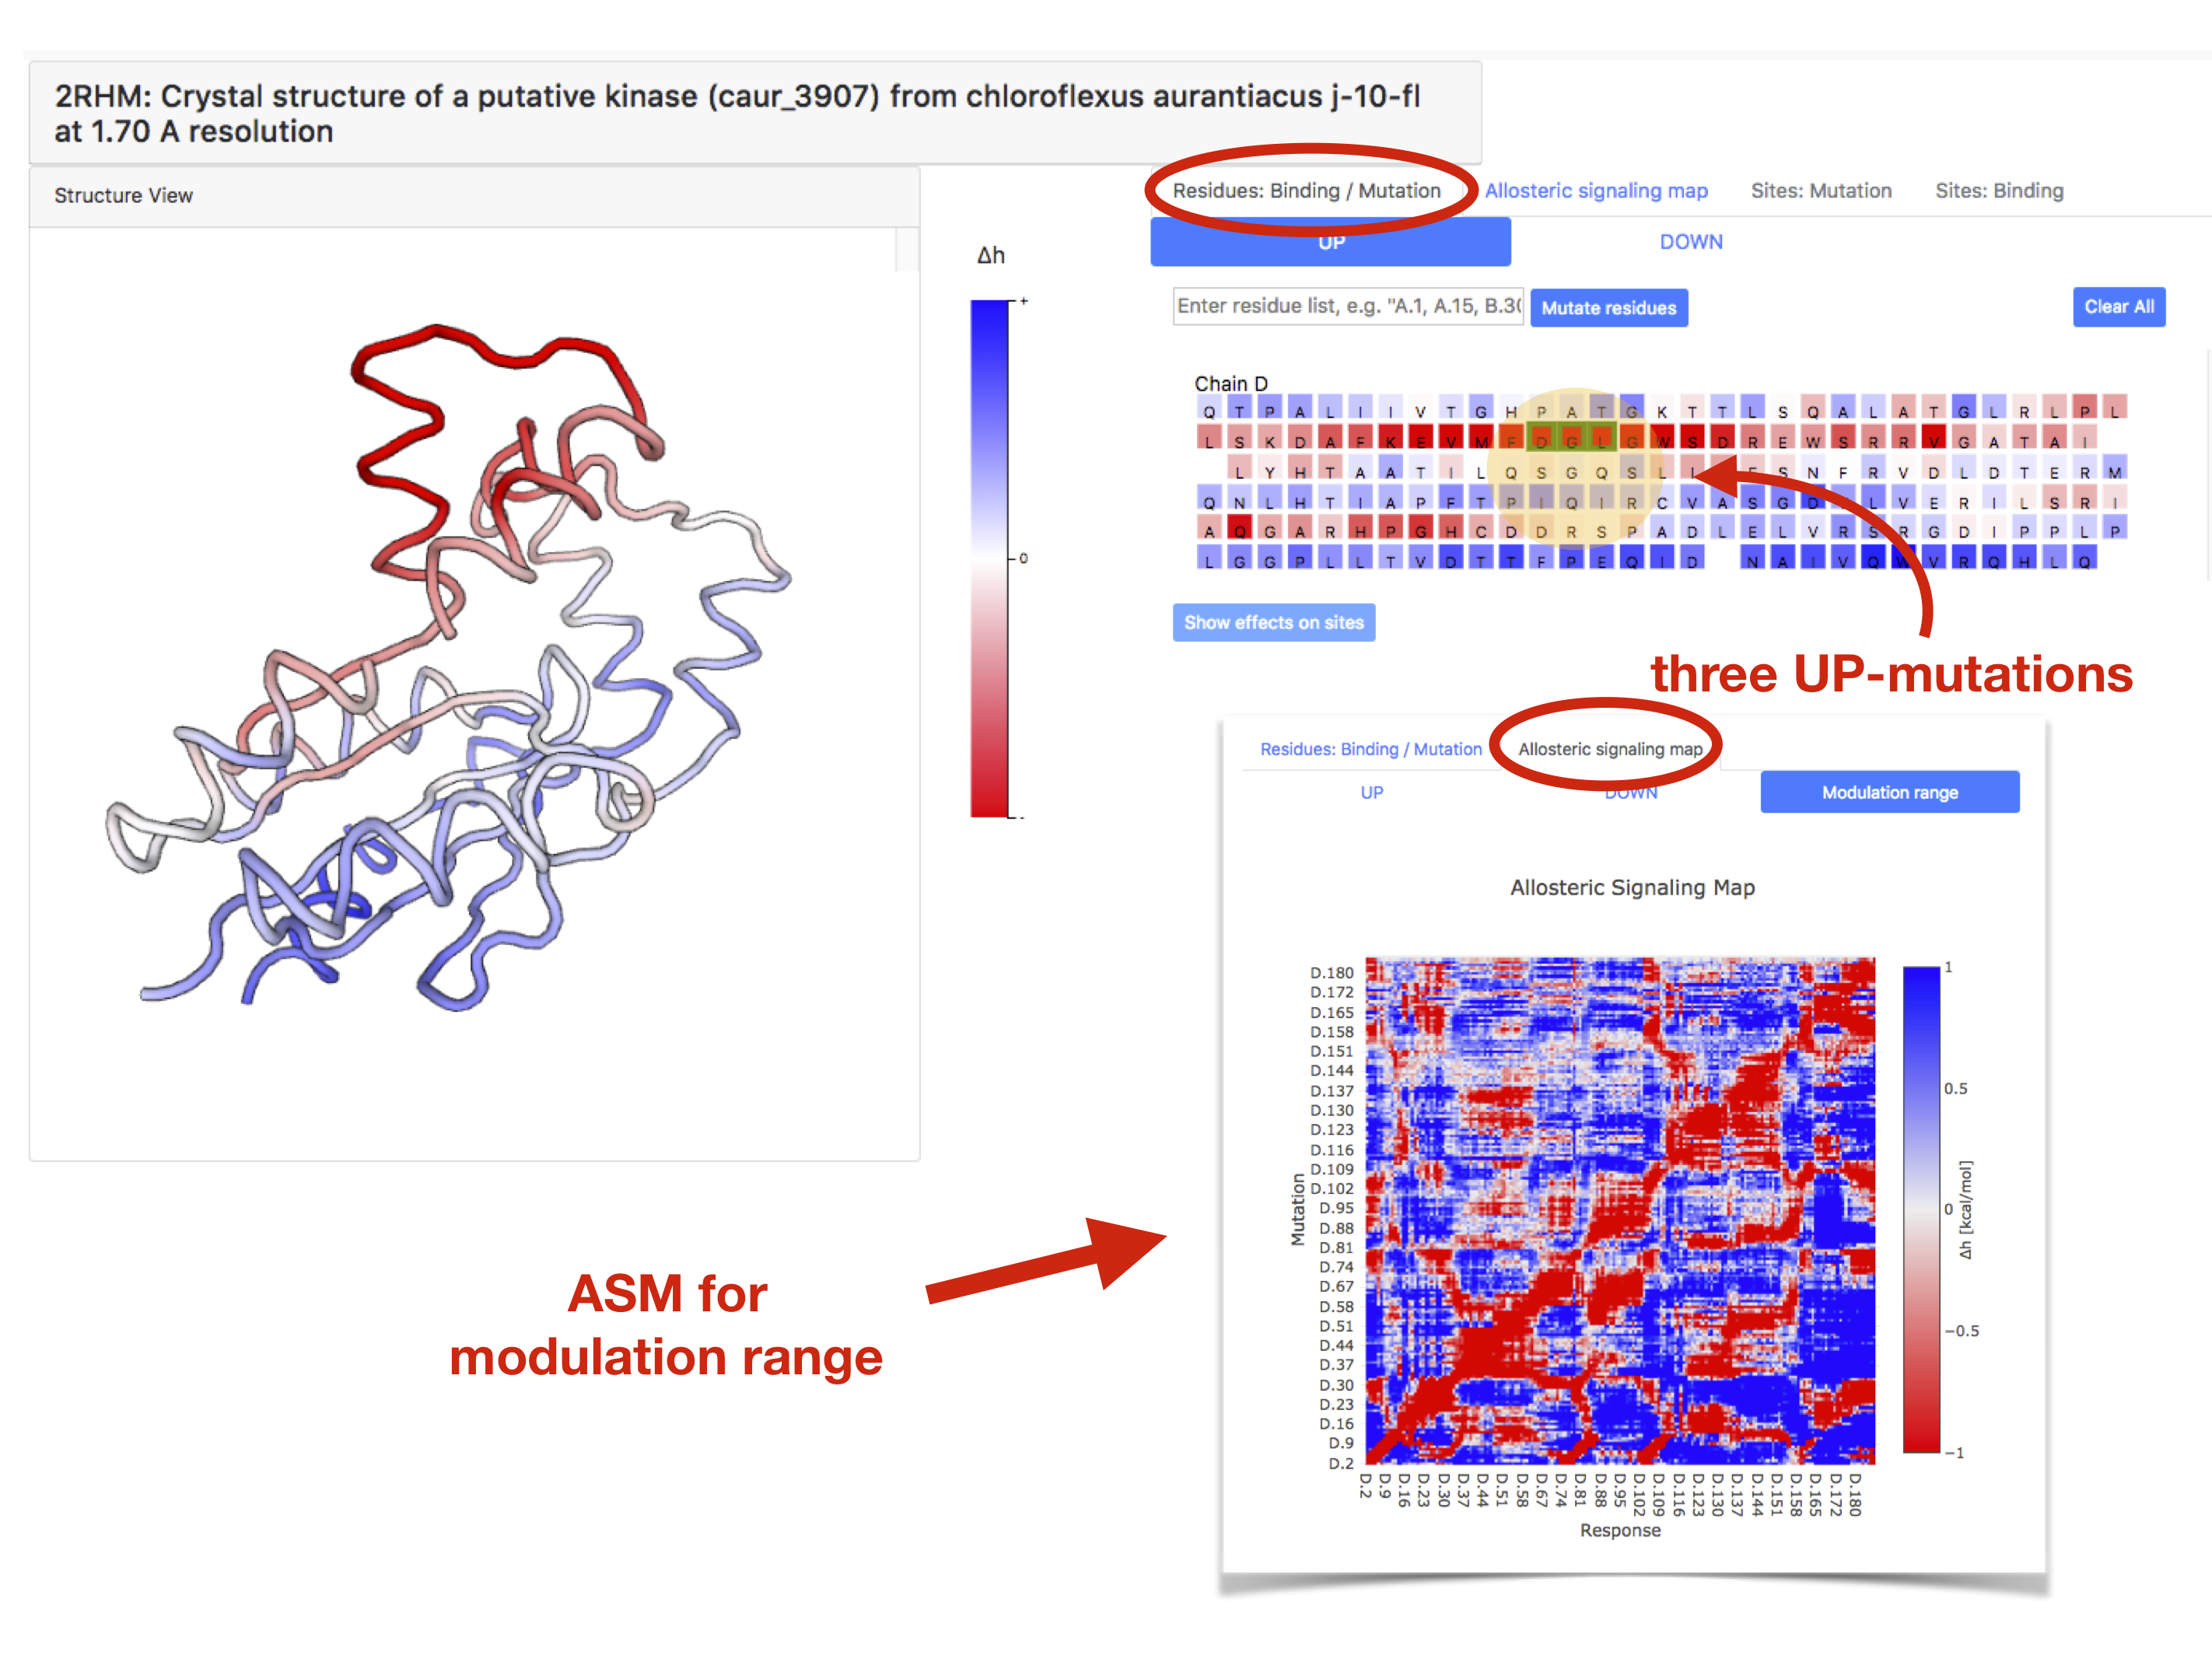
Figure 14: Presentation of the allosteric signalling data for 1908 protein chains of the PDBselect dataset.
Polymorphism
In the Polymorphism part of AlloMAPS database the allosteric signalling data were generated for 33 proteins with massive data on single nucleotide polymorphism (at least 50 SNPs in the protein) clearly linked to pathologies. The “Allosteric Polymorphism” icon in the main page leads users to the list of above mentioned 33 proteins. Six columns composing the table include PDB ID, UNIPROT ID, Gene name, Protein name, Protein size (in number of residues), and Pathology.
Figure 15 contains an example page for Cystathionine beta-synthase (PDB ID: 4coo). In the structure view panel known binding sites are complemented by the set of SNPs buttons. Pointing the cursor on corresponding button, the user can see information on related pathology. By clicking on SNPs tub, user can explore an allosteric signalling initiated by the UP or DOWN mutation in this position. Type of mutation (UP or DOWN) can be designated by the user by using corresponding UP/DOWN tabs in the right “Sequence view” panel.
Figure 15 exemplifies a case of DOWN mutation in position 435 if chain A listed in the polymorphism data. The effect of the mutation in terms of the per-residue allosteric modulation is shown on both structure and sequence views, and positions undergoing stronger/weaker modulation can be obtained by hitting High/Low 𝛥ℎ” buttons (see explanations for Figure 12 for more details).
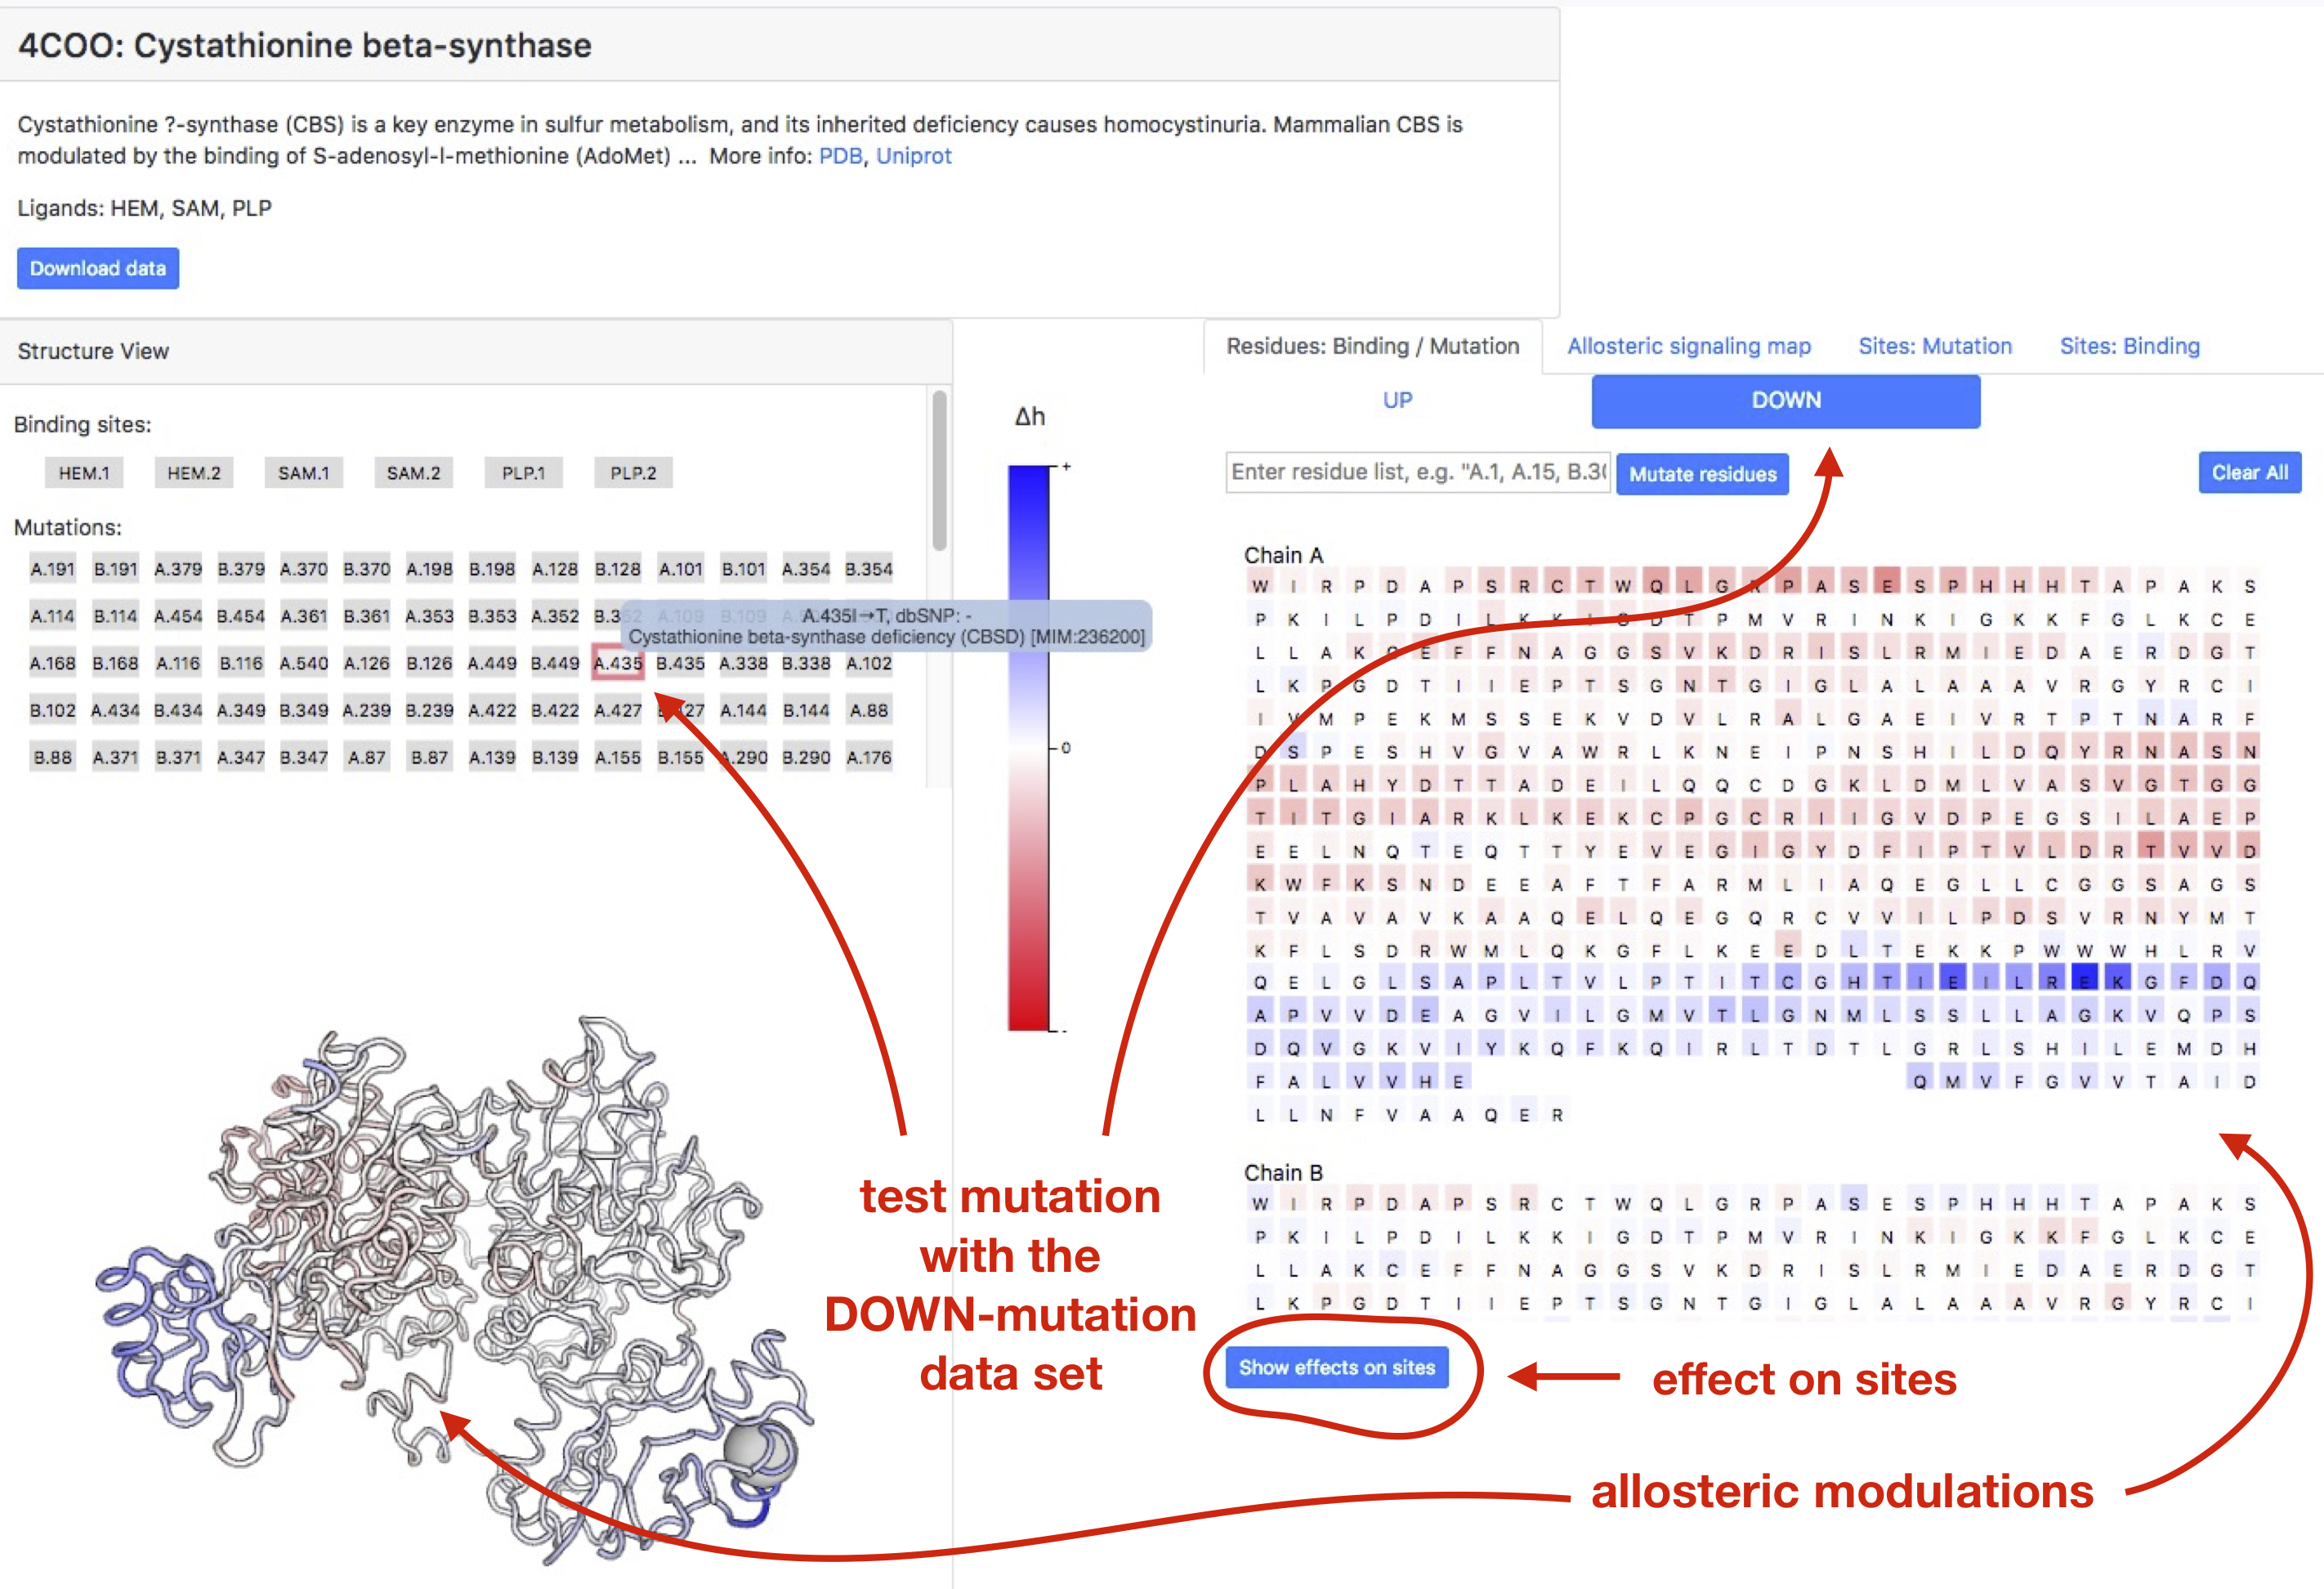
Figure 15: Exploring Cystathionine beta-synthase (PDB ID: 4coo) with SNPs linked to the Cystathionine beta-synthase deficiency condition.
AlphaFold proteomes
This part of the AlloMAPS database we catalog protein-wide allosteric communication in AlphaFold predicted protein structures from proteomes of 12 reference organisms and 14 pathogens [9, 10]. In the protein data home page (shown for instance in Figure 16), the UniProt ID and protein name are listed on the top left hand corner: Users may view more information about the protein and access external links by clicking on this bar to open the information panel. With pre-computed Allosteric Signaling Maps (ASMs), the user can visualize per-residue free energy changes in response to UP/DOWN mutations by selecting the mutated residues on the right panel. Users can also navigate to the ASM tab to see the full ASM matrix, and the mutated/responding residues are highlighted on the structure panel on the left when moving the mouse pointer along the ASM.
The Allosteric Probing Maps (APMs) [11] present the allosteric effects of probing the structure with small three-residue fragment that sequentially binds to the triplets of the protein chain. The APM provides an opportunity to scan the protein with small three-residue probes looking for locations that could be used as regulatory exosites. By combining a few of these locations that are remote in the protein sequence but adjacent in 3D, it is possible to design allosteric sites with required signaling strength to the functional sites, as well as to propose candidate effector molecules designed by combining respective probes.
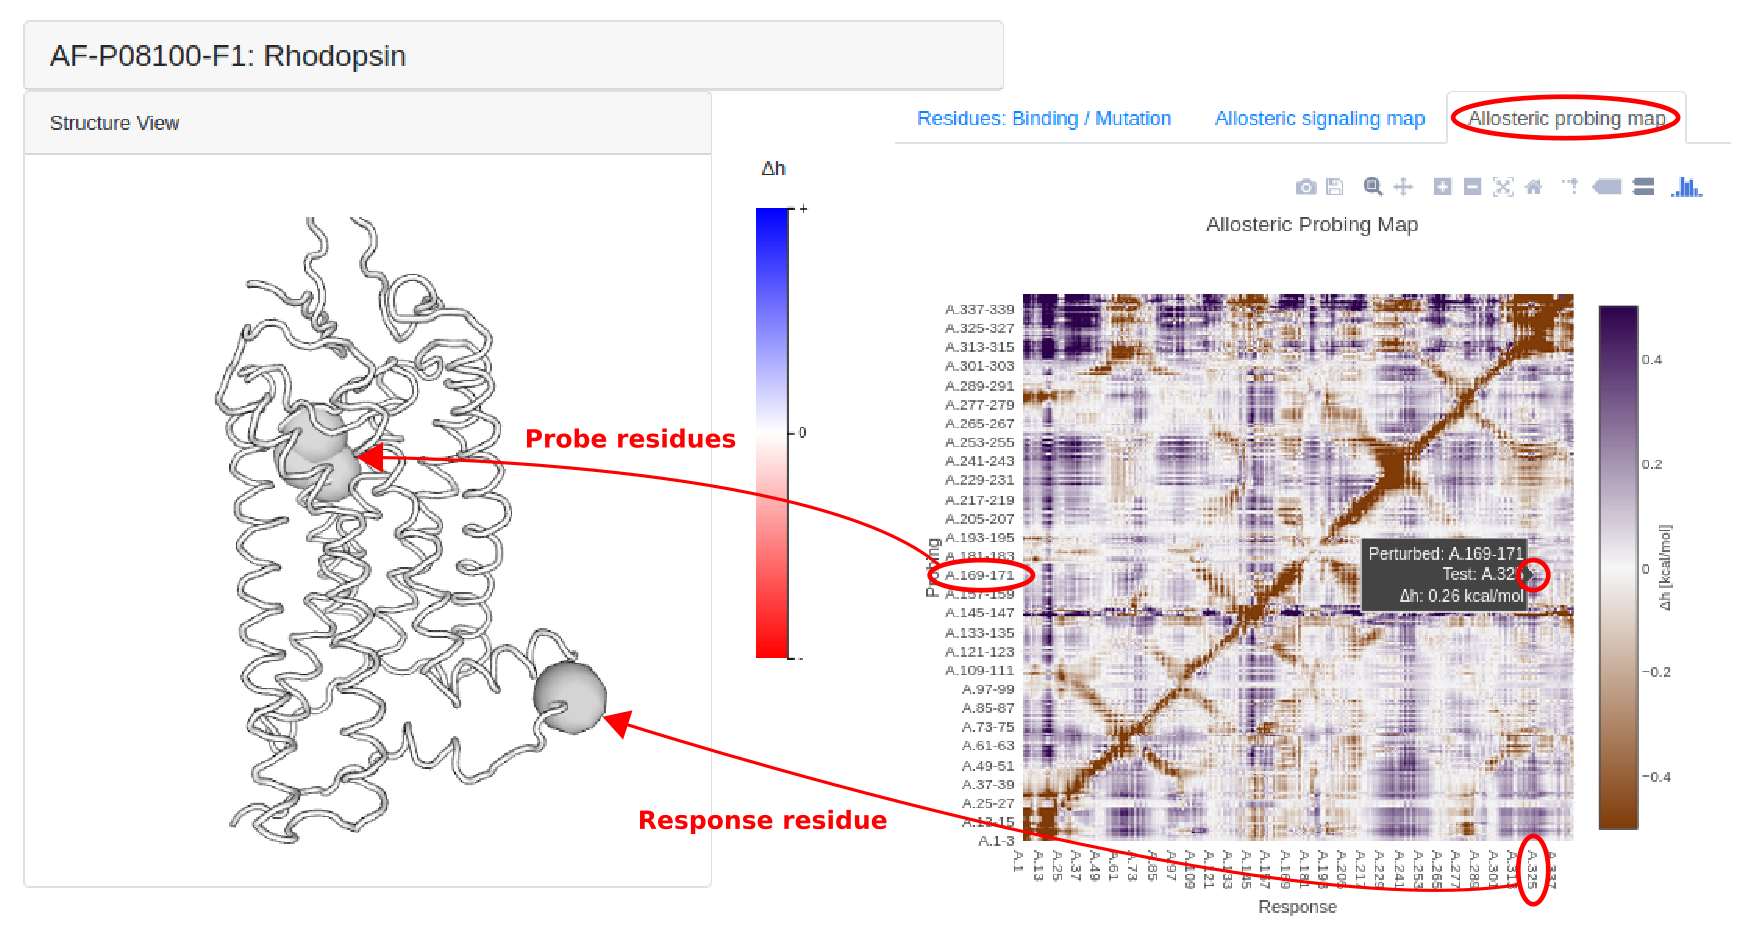
Figure 16: Allosteric Probing Maps show the free energy changes across the whole protein structure of human rhodopsin (P08100) as a result of small-probe binding to 3 consecutive residues and 9 nearest neighbors.
We recommend that users consider only structures with low-confidence residues (LCR) making up less than 20% of the structure (10% for prokaryotes), with a maximum LCR length of 25 (15 for prokaryotes). Further, structures with the first 20 residues from the N-terminus forming LCRs are excluded. LCRs are defined as residues with pLDDT < 70.
Users may browse through a list of selected high-quality AlphaFold predicted structures using the Browse option on the top nevigation bar, or from the AlphaFold Proteomes panel on the home page. After selecting an organism of interest, the user will arrive at the page shown in Figure 17, which enables the user to scroll through the selected structures that satisfy the above quality control criteria and contain more than 100 residues. If users wish to, information on the full list of AlphaFold structures can be accessed by downloading the TSV table linked at the top of the page, and data on specific structures can be viewed by entering the UniProt ID directly in the search bar.
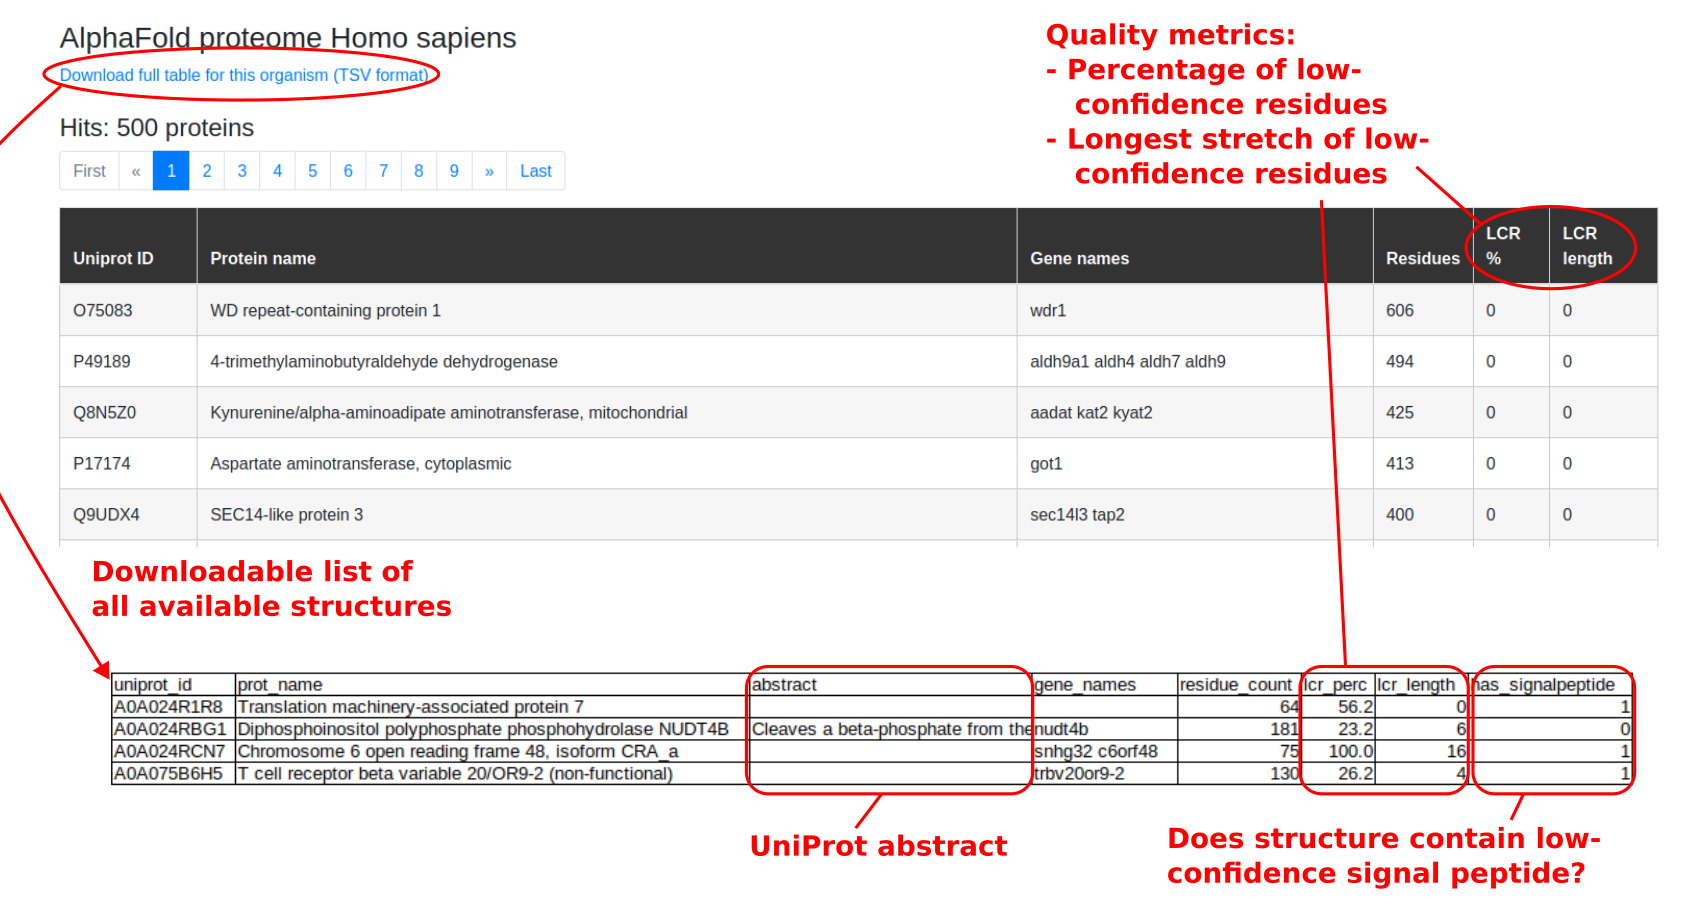
Figure 17: Selected list of high-quality human protein structures predicted by AlphaFold. Only structures satisfying the quality criteria can be found via general searches, while the Browse function shows only structures that meet the quality criteria, and are above 100 residues in size. Users may choose to download the full table of information in available structures, which also provides the quality metrics used.
Pfam 6370
Here, we document protein-wide allosteric communication in 6370 protein domains in the Pfam database, that have structures predicted using trRosetta [12,13]. Similar to the AlphaFold structures, the database enables users to explore the free energy effects of mutations and small probe binding across the protein, using the Allosteric Signaling Map (ASM) and Allosteric Probing Map (APM), respectively.
We recommend that users consider only structures with low-confidence regions (LCR) making up less than 20% of the structure, with a maximum LCR length of 25. LCRs are defined as residues with lDDT < 0.7. As with the AlphaFold dataset, information on the full list of protein families is available via download, linked at the top of the Pfam Browse page.
Structure search
The top navigation bar in the database site allows for a general text-based search for protein (or protein family) structures, within each of the datasets cataloged. The "PDB" dataset represents the combination of the "Allosteric proteins", "PDBselect chains", and "Polymorphism" sets.
In the search results table, users can access the structure view of a selected protein by clicking on the corresponding row.
Alternatively, users may also enter the following unique ID associated with each entry for direct access:
- PDB (Allosteric proteins / PDBselect chains / Polymorphism): 4-letter PDB ID
- AlphaFold: 6- or 10-letter UniProt ID
- Pfam (Protein families): 7-letter Pfam ID
- GPCRaf (GPCRs): 6- or 10-letter UniProt ID
Note: For AlphaFold and Pfam predicted structures, we recommend that users consider only structures with low-confidence regions (LCR) making up less than 20% of the structure, with a maximum LCR length of 25. LCRs are defined as residues in predicted structures with pLDDT < 70 (for AlphaFold) or lDDT < 0.7 (for Pfam-trRosetta).
Large structures
In view of memory limitations for typical browsers, for large structures (above 1200 residues) it is not possible to load the full dataset on the web interface directly for interactive visualization. For these cases, the system will pre-load the allosteric communication data (ASM, APM, and effects of ligand site-binding) within the first 800 residues. Sliders in the View Selection panel on the top right allows the user to choose different ranges of perturbations and response residues to look at, and load the data using the "Update" button. Note that, in order to keep within memory limits, at most 1200 perturbation or response residues can be selected at one time. For further analysis, users may download the full dataset using the "Download Data" button in the Information panel.
Note that the loading of individual protein records may take up to a couple of minutes, depending on the size of the system. After selecting a new View window using the View Selection panel, please wait for the system to finish loading (as shown by the progress bar) before interacting with the interface.
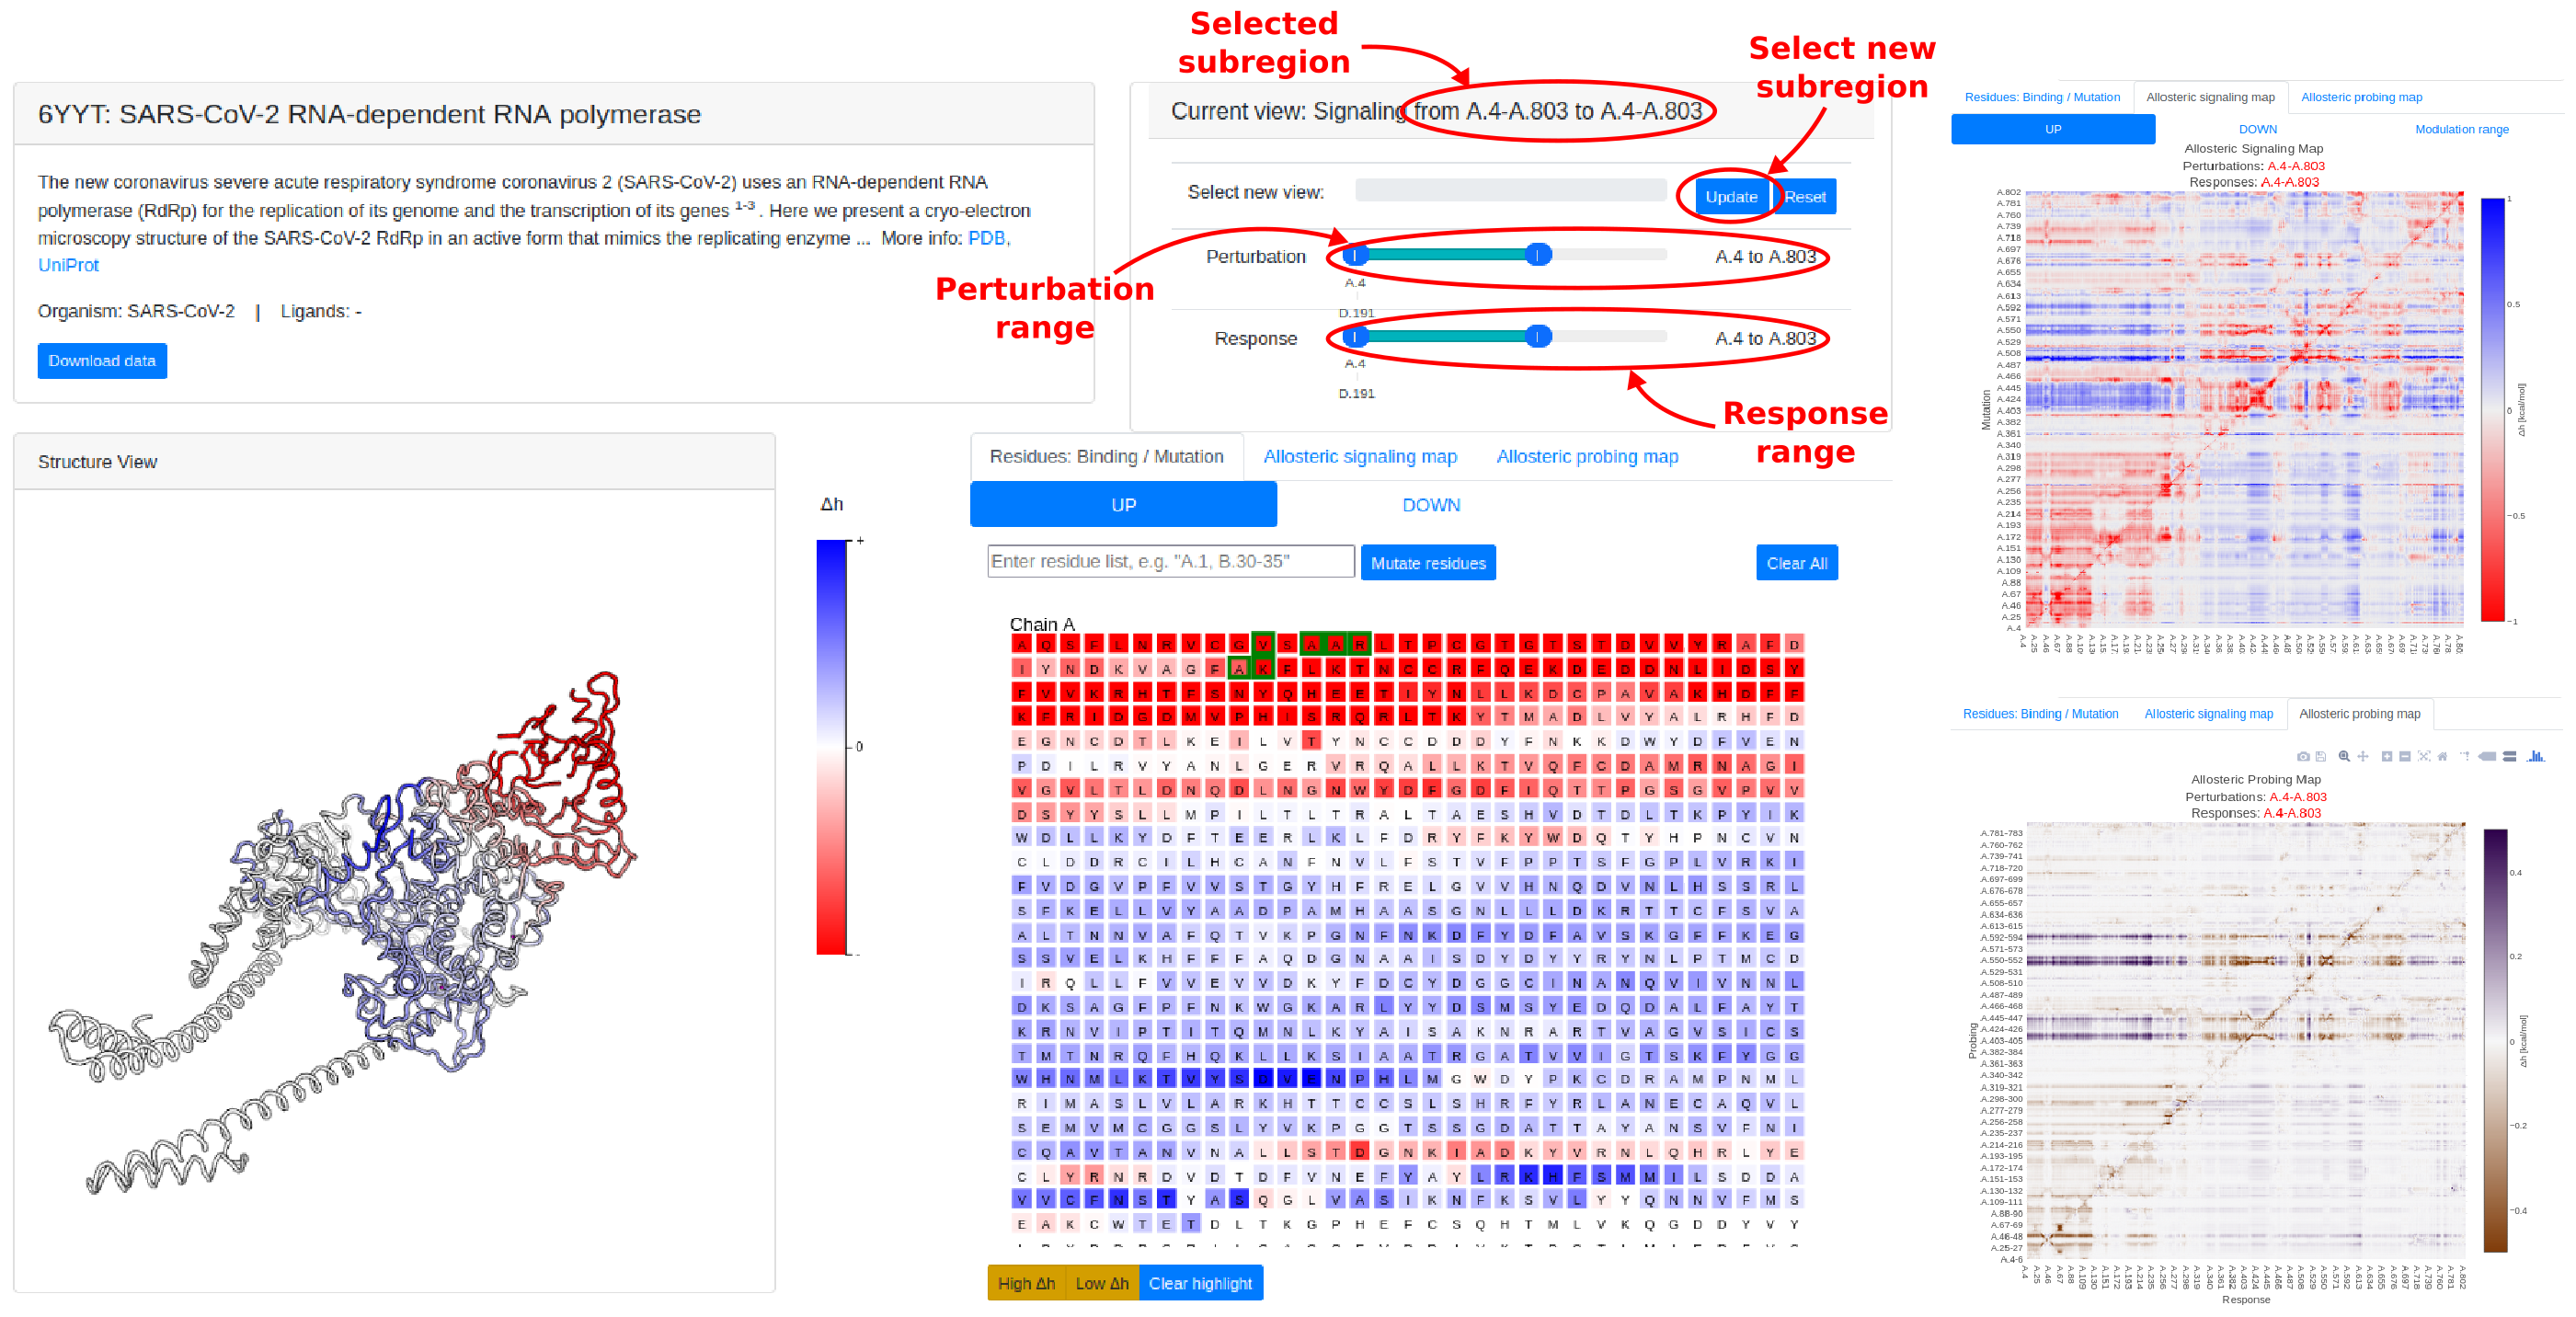
Figure 17: Example of a large protein structure, the SARS-CoV-2 RNA-dependent RNA polymerase (PDB ID: 6yyt). Instead of loading the full dataset forinteractive data visualization on the web interface, the browser pre-loads allosteric communication data for the first 800 residues only. The user can then change the range of perturbation/response residues using the slider bars, and click Update to load the communication data in the new region.
Allosteric fingerprints
With the June 2022 update, the allosteric signaling/probing maps (ASM/APMs) are shown as allosteric fingerprints [14]: This enables users to observe spatial patterns in allosteric communication, and focus their attention to distant regions with strong signaling. Regions representing nearby residue pairs (less than 11 Ang apart) or with weak allosteric interaction (|ΔH| < 0.1 kcal/mol) are masked in cyan, and users may still see the signaling strength in masked regions by hovering the mouse over residues of interest.
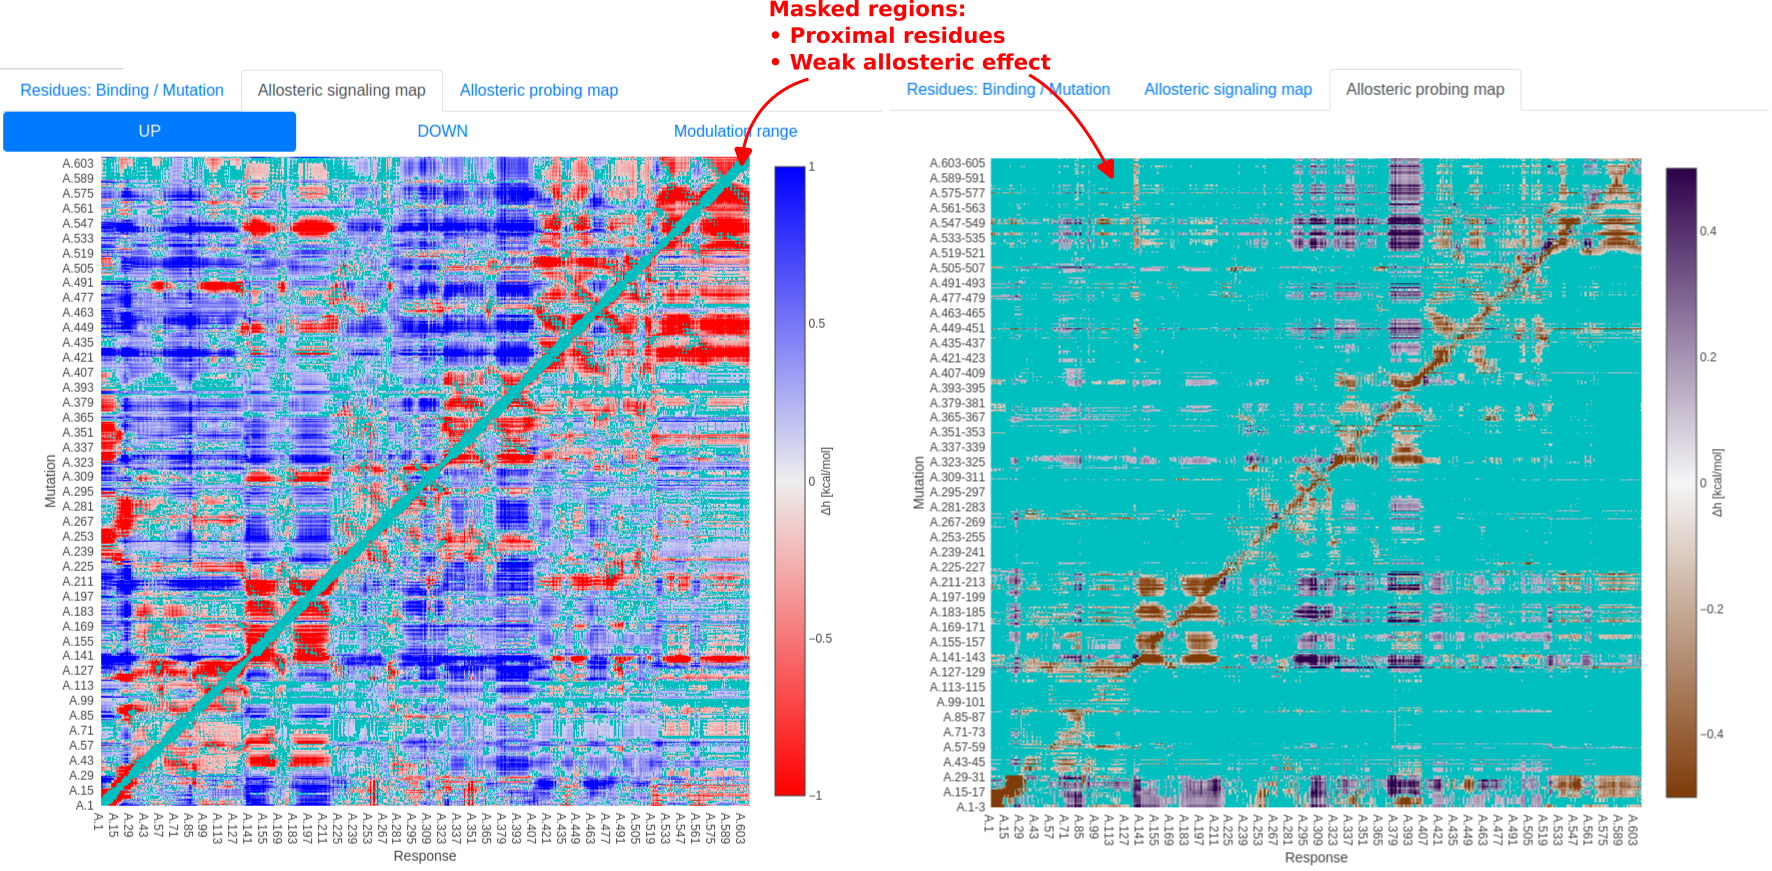
Figure 18: Allosteric fingerprint of human albumin (P02768), with structure predicted by AlphaFold. Regions representing nearby residue pairs or with weak allosteric interaction are masked in cyan.
Datasets
Users may download archived data visualized on the database for further processing, using the "Download data" button on the protein info panel (Figure 4). This will be available as a .zip file, containing the following data files (in JSON format, except the PDB structure) generally:
Structure data:
- [PDB ID].pdb: PDB structure data
- distData.json.gz: 2D inter-residue distance matrix, as gzipped file
Annotation data:
- proteinInfo.json / proteinFamilyInfo.json: Basic information about the protein (or protein family)
- chains.json: Amino acid sequences of protein chains
- residues.json: List of residues included in all computations
- siteData.json: Protein residues constituting each binding site
- mutData.json: Residues corresponding to pathogenic SNPs
- mutInfo.json: Annotation data for pathogenic SNPs
Allosteric signaling data:
- siteDGdata.json: Per-residue free energy as a result of ligand binding combinations
- siteIntNetwork.json: allosteric interaction between the binding of different ligands
- mutDGdataPlus.json.gz: UP-mutation ASM, as gzipped 2D matrix
- mutDGdataMinus.json.gz: DOWN-mutation ASM, as gzipped 2D matrix
- mutDGdataDelta.json.gz: Modulation range ASM, as gzipped 2D matrix
The following files are also available for structures with pre-computed Allosteric Probing Maps (APMs):
- probeDGdataPlus.json.gz: APM, as gzipped 2D matrix
- probeLocs.json: List of residue triplets probed in the APM
Note that large structures and newer datasets may contain data in slightly different or more compact formats: please refer to the README file contained in the downloaded .zip file for details on file formats and how to retrieve the data.
Notes on browsers
This database has been tested on the following browsers:
- Mozilla Firefox Version 100+
- Google Chrome Version 102+
For optimal browsing experience, we recommend using Firefox Version 100 and higher.
Citing AlloMAPS
Please support this work by citing our publication on Nucleic Acids Research, linked here [8].
References
-
[1] Griep, S. & Hobohm, U.
PDBselect 1992–2009 and PDBfilter-select.
Nucleic Acids Research 38, D318–D319 (2010)
-
[2] Dawson, N. L., Lewis, T. E., Das, S., Lees, J. G., Lee, D., Ashford, P., Orengo. C. A. & Sillitoe I.
CATH: an expanded resource to predict protein function through structure and sequence.
Nucleic Acids Research 45, D289–D295 (2017)
-
[3] Guarnera, E. & Berezovsky, I. N.
Structure-Based Statistical Mechanical Model Accounts for the Causality and Energetics of Allosteric Communication.
PLoS Comput Biol 12, e1004678 (2016).
-
[4] Kurochkin, I. V., Guarnera, E., Wong, J. H., Eisenhaber, F. & Berezovsky, I. N.
Toward Allosterically Increased Catalytic Activity of Insulin-Degrading Enzyme against Amyloid Peptides.
Biochemistry 56, 228–239 (2017).
-
[5] Guarnera, E., Tan, Z. W., Zheng, Z. & Berezovsky, I. N.
AlloSigMA: allosteric signaling and mutation analysis server.
Bioinformatics 33, 3996–3998 (2017).
-
[6] Tee, W. V., Guarnera, E. & Berezovsky, I. N.
Reversing allosteric communication: From detecting allosteric sites to inducing and tuning targeted allosteric response.
PLoS Comput Biol 14, e1006228 (2018).
-
[7] Guarnera, E. & Berezovsky, I. N.
Towards comprehensive allosteric control over protein activity.
Structure 27, 866-878.e1 (2019)
-
[8] Tan, Z. W., Tee W.-V., Guarnera E., Booth L. & Berezovsky I. N.
AlloMAPS: allosteric mutation analysis and polymorphism of signaling database.
Nucleic Acids Research 47, D265–D270 (2019).
-
[9] Jumper, J. et al.
Highly accurate protein structure prediction with AlphaFold
Nature, Volume 596, 583-589 (2021).
-
[10] Varadi, M. et al.
AlphaFold Protein Structure Database: massively expanding the structural coverage of protein-sequence space with high-accuracy models
Nucleic Acids Research, Volume 50, Issue D1 D439-D444 (2022).
-
[11] Tan, Z. W., Guarnera, E., Tee, W. V. & Berezovsky, I. N.
AlloSigMA 2: paving the way to designing allosteric effectors and to exploring allosteric effects of mutations
Nucleic Acids Research, Volume 48, Issue W1 W116–W124 (2020).
-
[12] Pfam releases structures for every protein family. (2021, March 2). EMBL’s European Bionformatics Institute. Web link
-
[13] Yang, J., Anishchenko, I., Park, H., Peng, Z., Ovchinnikov, S. & Baker, D.
Improved protein structure prediction using predicted interresidue orientations
PNAS 117 (3), 1496-1503 (2020).
-
[14] Tee, W. V., Tan, Z. W., Guarnera, E. & Berezovsky, I. N.
Conservation and Diversity in Allosteric Fingerprints of Proteins for Evolutionary-inspired Engineering and Design
Journal of Molecular Biology 434 (17), 167577 (2022)